
The St. Paul housing market in September 2026 is one of the best values in the Twin Cities. The average St. Paul home sold for $357,891, about $117,000 (roughly 25%) less than the Twin Cities region average of $474,936, according to NorthstarMLS InfoSparks data. St. Paul still has just 2.6 months of supply, so well-priced homes keep selling while buyers get more room to negotiate than they had a year ago.
For buyers, that means more house for the money without leaving the urban core. For sellers, it means pricing right from day one matters more than ever, because buyers now have more options across the metro.
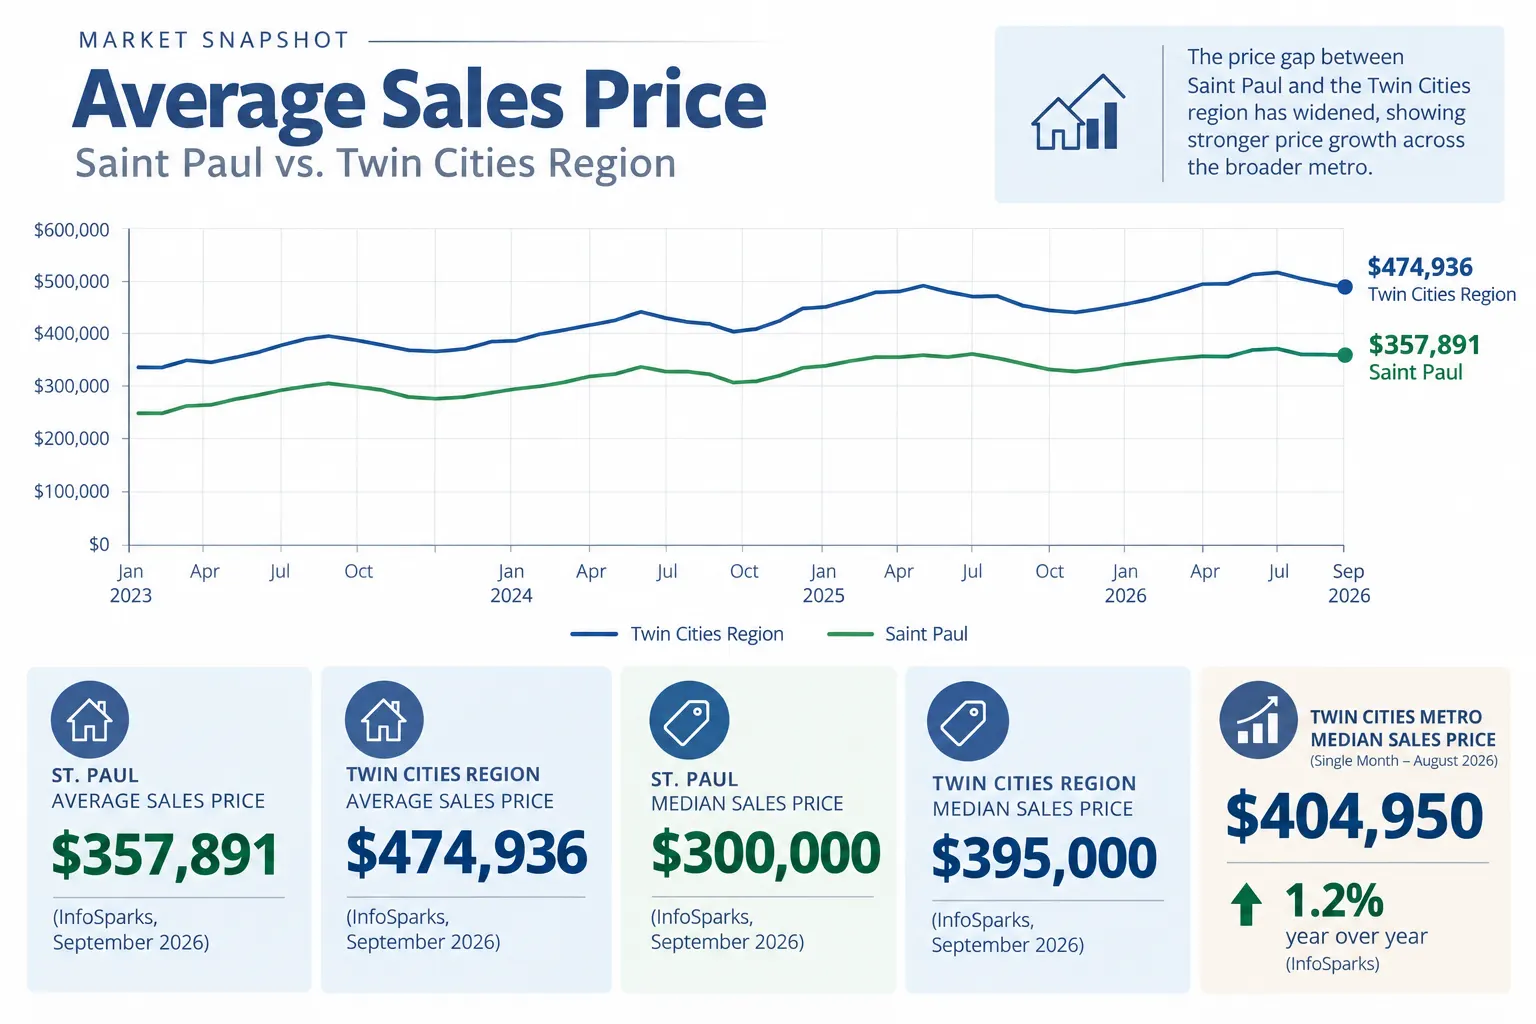
St. Paul home prices in 2026 average $357,891, compared with $474,936 across the Twin Cities region (12 months ending September 2026, NorthstarMLS InfoSparks). That gap of $117,045 makes St. Paul one of the most affordable large markets in the metro. The St. Paul median home price is $300,000, versus $395,000 for the Twin Cities region, a $95,000 difference.
St. Paul prices climbed steadily from about $323,000 in early 2023 to a peak near $365,000 in early 2026. Since then, the average has leveled off slightly, while the regional average kept rising. That flattening widens St. Paul’s value advantage instead of shrinking it.
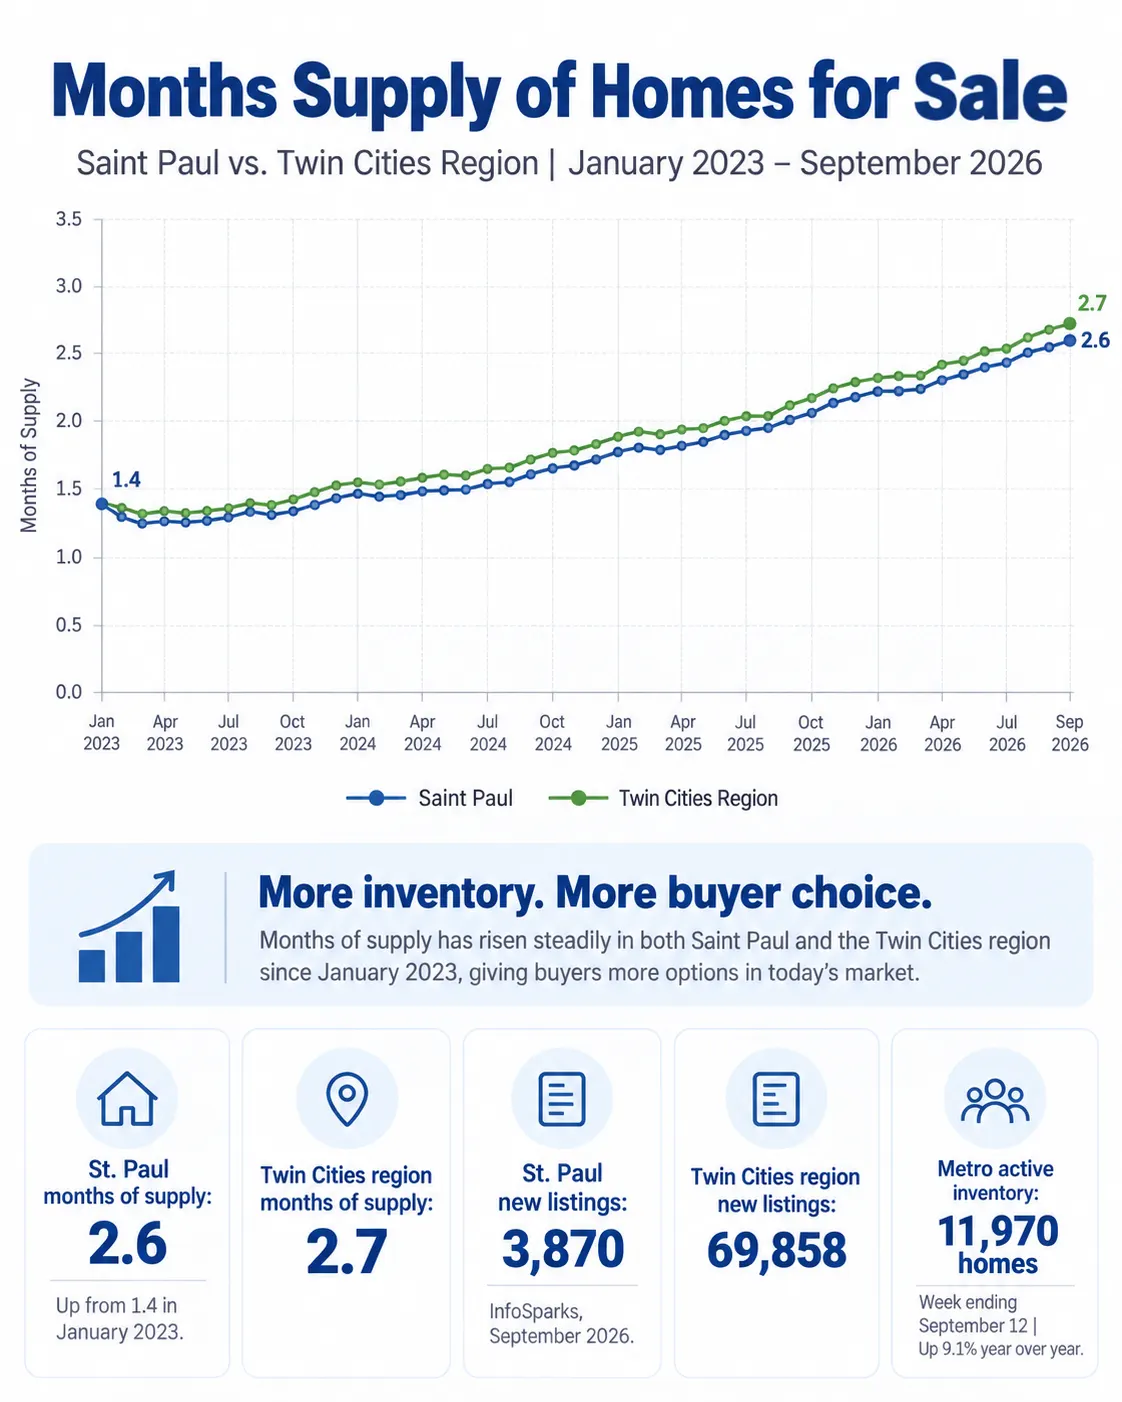
St. Paul has 2.6 months of housing inventory as of September 2026, compared with 2.7 months for the Twin Cities region. Anything under roughly 4 to 5 months is generally considered a seller-leaning market, so homes are still moving. But St. Paul’s supply has nearly doubled from 1.4 months in January 2023, which gives buyers far more choice than they had two years ago.
Pending sales across the metro fell 15.9% to 769 for the week ending September 12, while new listings held flat (up 0.4% to 1,605). Fewer accepted offers plus steady new supply is a classic fall slowdown, and it tilts negotiating leverage toward buyers.
St. Paul homes sell in a median of 21 days, three days faster than the Twin Cities region median of 24 days (12 months ending September 2026, InfoSparks). Market times have crept up from about 19 days in 2025, but St. Paul still moves faster than the metro overall. Across the metro, homes averaged 45 days on market in August 2026, up 7.1% from a year earlier.
St. Paul sellers are also holding price better than the region. The median St. Paul home sold for 100% of its original list price, compared with 99.8% for the Twin Cities region, which slipped in recent months.
Kerby & Cristina sellers averaged 101% of list price in 2025, ahead of the St. Paul median of 100% and the Twin Cities metro 12-month average of 98.5%. On a $300,000 St. Paul home, the 2.5-point gap over the metro average is worth about $7,500 at closing. Strong pricing strategy, preparation, and marketing are what close that gap. See how we market a home so buyers feel its story.
St. Paul is still a slight seller’s market in September 2026, but it is moving toward balance. With 2.6 months of supply, a median of 21 days on market, and homes selling at 100% of original list price, well-priced homes in good condition continue to sell. Overpriced homes, however, are sitting longer and seeing price reductions.
Here is what each side should expect this fall:
Want to dig deeper? Read our guide to navigating a balanced market as a buyer or seller and what buyers can negotiate in today’s market.
Yes. St. Paul housing affordability is among the best in the Twin Cities, with average prices about 25% below the regional average. The metro-wide Housing Affordability Index was 116 in August 2026, meaning the median household earns 116% of the income needed to buy the median-priced metro home. Because St. Paul prices run well below that median, the same household has even more buying power here.
At the $300,000 St. Paul median versus the $395,000 regional median, buyers start with $95,000 less to finance. At today’s rates, that difference can mean several hundred dollars less per month.
St. Paul is generally the more affordable of the two core cities. [Insert current Minneapolis average or median sales price from InfoSparks for a direct comparison.] Both cities offer walkable neighborhoods, transit, and established housing stock, but St. Paul’s lower entry point stretches a buyer’s budget further.
For the Minneapolis side of the comparison, see our Minneapolis Housing Market Update 2026 and Minneapolis vs. Suburbs: Where Home Values Are Growing in 2026.
Affordable homes in St. Paul, MN are spread across the East Side, North End, Frogtown, and Hamline-Midway, while premium neighborhoods like Highland Park and Summit Hill still cost less than comparable Minneapolis and suburban areas. St. Paul’s citywide median of $300,000 sits $95,000 below the Twin Cities region median of $395,000. That gap is the core of St. Paul’s value story.
How St. Paul neighborhoods generally break down by price tier:
St. Paul buyers also get big-city amenities at a smaller-city price. Think Saints games at CHS Field (we host our annual client appreciation BBQ there), Como Park Zoo and Conservatory, the Mississippi River trails, and Lowertown’s food scene. For more neighborhood ideas, see The Ultimate Guide to Twin Cities Neighborhoods for Homebuyers.
The St. Paul housing market in 2026 remains one of the best values in the Twin Cities: homes average about $117,000 less than the regional average, and supply sits at a still-tight 2.6 months. Buyers get more choice and negotiating power than they have had in years. Sellers who price right and prepare well are still getting strong results.
If you are weighing a move, timing and strategy matter. Read Should You Wait for Mortgage Rates to Drop? and Selling Your Twin Cities Home This Fall? for next steps.
Search St. Paul homes for sale or start with our buyer questionnaire.
Get a free St. Paul home valuation and see how our 2025 average of 101% of list price could work for you.
Call Kerby & Cristina Real Estate Experts at 763-634-0073 or contact us online.
Yes. St. Paul homes average $357,891, about $117,000 less than the Twin Cities region average, and inventory has nearly doubled since 2023. Buyers get urban amenities, historic neighborhoods, and more negotiating room than in recent years.
The St. Paul median home price is $300,000 for the 12 months ending September 2026, according to NorthstarMLS InfoSparks. That compares with a Twin Cities region median of $395,000.
St. Paul prices have flattened rather than dropped sharply. The average sales price peaked near $365,000 in early 2026 and stood at $357,891 in September, while the regional average kept rising.
St. Paul has 2.6 months of supply as of September 2026, compared with 2.7 months across the Twin Cities region. That is up from just 1.4 months in January 2023.
Yes, if the home is priced correctly. Supply is still below balanced-market levels, but buyers have more choices, so pricing and presentation decide how fast you sell. St. Paul homes sell in a median of 21 days at 100% of original list price, and Kerby & Cristina sellers averaged 101% of list price in 2025.
Data sources: NorthstarMLS InfoSparks (St. Paul and Twin Cities Region, 12 months of activity ending September 2026, data as of October 1, 2026); Minneapolis Area REALTORS Weekly Market Activity Report, week ending September 12, 2026 (published September 21, 2026); Freddie Mac mortgage rate data as cited in that report.