
Across the Twin Cities region, homes are taking 41 days to sell and closing at 99.1% of list price as of the most recent month reported (July 2026). Weekly data through September 5 shows pending sales up 7.8% year over year, even as new listings dropped 16.7% and inventory grew 10.1%. Translation: fewer new homes are hitting the market, but the ones that are listed are still finding buyers, and supply is loosening just enough to give buyers more room to negotiate. It's a market that rewards sellers who price accurately and buyers who move decisively once they find the right home.
Whether you’re buying or selling in Minneapolis right now, the numbers below explain why.
For the bigger picture on where the market has been trending all year, see our Mid-Year 2026 Housing Market Update.
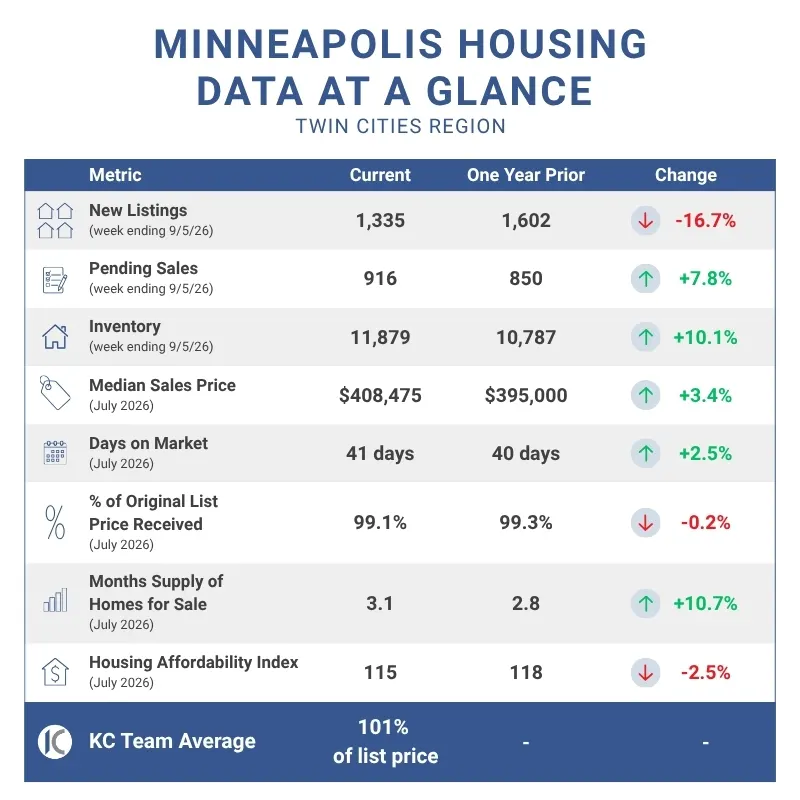
All figures from NorthstarMLS, provided by Minneapolis Area REALTORS® (MAAR), for the week ending September 5, 2026 and the month of July 2026.
Short answer: It’s a genuinely balanced market, good news for both sides, but the details matter depending on your timeline.
Buyers are getting more breathing room (inventory up 10.1%, months supply up 10.7% to 3.1) without losing urgency (pending sales still up 7.8%). Sellers are still closing near full price (99.1%), but the gap between correctly priced and overpriced homes is starting to show. For a fuller framework on navigating this in-between phase, see our piece on how to tackle a balanced market.
Twin Cities homes closed in July 2026 after 41 days on market, up slightly (2.5%) from 40 days a year earlier, and up from 36 days in July 2024. That’s a gradual, not dramatic, cooling: buyers have more time to compare options than they did two years ago, but homes still aren’t sitting for months.
This pace also lines up with fall timing. If you’ve been waiting for the “right moment” to list, the fall window in the Twin Cities tends to draw serious, motivated buyers even as overall traffic slows. Our recent piece on why fall is a smart time to list breaks down what that looks like in practice this year.
Homes are closing at 99.1% of original list price in July, essentially flat versus a year ago (99.3%), and the 12-month average has slipped slightly to 98.5% from 98.7%. That’s a market where full asking price, or just a hair under, remains the norm rather than the exception.
Well-priced homes in strong locations are still drawing competitive activity. If you’re a buyer heading into a multiple-offer situation, our guide on how to win in multiple offers walks through the specific strategies that give buyers an edge.
Three weekly numbers, read together, tell the real story right now:
That combination, fewer new listings but rising total inventory, usually means existing listings are taking longer to clear, which tracks with the days-on-market increase above. If you’re comparing new construction against resale inventory in this environment, our guide to navigating new construction incentives in the Twin Cities is worth a look, since builder incentives shift with these same supply dynamics.
The U.S. economy added 162,000 jobs in August, more than three times what economists had forecast, according to the Bureau of Labor Statistics, with upward revisions to prior months on top of that. Residential construction alone added 7,300 positions.
A stronger-than-expected labor market is good news for economic stability, but it also changes the calculus on interest rates: a resilient job market makes it less likely the Federal Reserve moves to cut rates at its September meeting, and it raises the odds rates could tick up instead. If you’ve been sitting on the sidelines waiting for rates to drop, it’s worth running the numbers now. Our breakdown of what waiting on rates actually cost Twin Cities buyers last year shows exactly what that trade-off looked like.
As of September 2026, Twin Cities homes are taking 41 days to sell and closing at 99.1% of list price, with the median sale price up 3.4% year over year to $408,475. Rising inventory and a 10.7% jump in months supply signal a market that’s slowly rebalancing toward buyers, even as pending sales climb and well-priced homes still move at a healthy pace.
If you’re weighing whether to buy or sell in Minneapolis right now, the best realtor in Minneapolis for your situation is one who can translate this data into a specific plan for your home or your search. Reach out to our team for a personalized breakdown.
It depends on your timeline, but current data supports action on both sides. Buyers have more inventory and negotiating room than a year ago; sellers are still closing near full asking price if priced correctly from day one.
As of July 2026, homes averaged 41 days on market, up 2.5% from 40 days a year earlier, according to NorthstarMLS data reported by Minneapolis Area REALTORS®.
Homes closed at 99.1% of original list price in July 2026, essentially flat compared to 99.3% a year earlier, with the 12-month average at 98.5%.
The median sales price reached $408,475 in July 2026, up 3.4% from $395,000 in July 2025.
Yes. Inventory was up 10.1% year over year for the week ending September 5, 2026, and months supply of homes for sale rose 10.7% to 3.1, the highest level in recent memory for this market.