
There is no single city that is "winning" in 2026. Minneapolis home values vs. suburbs is really a city-by-city question, not a two-way race. Regionally, the median Twin Cities sales price rose 3.4% to $408,475 in July 2026, and inventory is still running well above last year's levels even though the newest weekly data (week ending September 5) shows new listings pulling back and pending sales picking up. Within our own 21-city, 904-transaction footprint, Minneapolis, Plymouth, and Saint Paul remain the busiest markets by volume, while smaller suburbs like Otsego and Corcoran show early signs of faster percentage growth simply because they are earlier in their growth curve. Confirming exactly which suburb is appreciating fastest requires city-by-city price data, which is why we recommend a direct comparison for your specific city rather than relying on one metro-wide number.
Jump to: The 2026 Big Picture | Fastest-Growing Suburbs | Why Growth Varies by City | For Buyers | For Sellers | FAQ
Is it a better move to buy in Minneapolis or in a Twin Cities suburb right now? It is one of the most common questions we hear from Minnesota homebuyers in 2026, and one of the hardest to answer with a single sound bite.
The truth is that Minneapolis vs. suburbs is not really a two-way comparison. The Twin Cities is made up of dozens of individual markets, each with its own pace of price growth, its own inventory picture, and its own buyer demand. Our Ultimate Guide to Twin Cities Neighborhoods for Homebuyers is a good companion to this piece, since it breaks down what makes individual communities feel different day to day.
That is where our data comes in. In 2025, we closed 904 homes for $353M+ in closed volume across a 21-city footprint, led by Minneapolis, Plymouth, Saint Paul, Maple Grove, and Brooklyn Park. That kind of citywide depth gives us a view of the market that broader regional reports simply cannot offer.
Regionally, the Twin Cities market kept climbing through July 2026, with prices up modestly and inventory rising enough to give buyers a little more breathing room than a year ago.
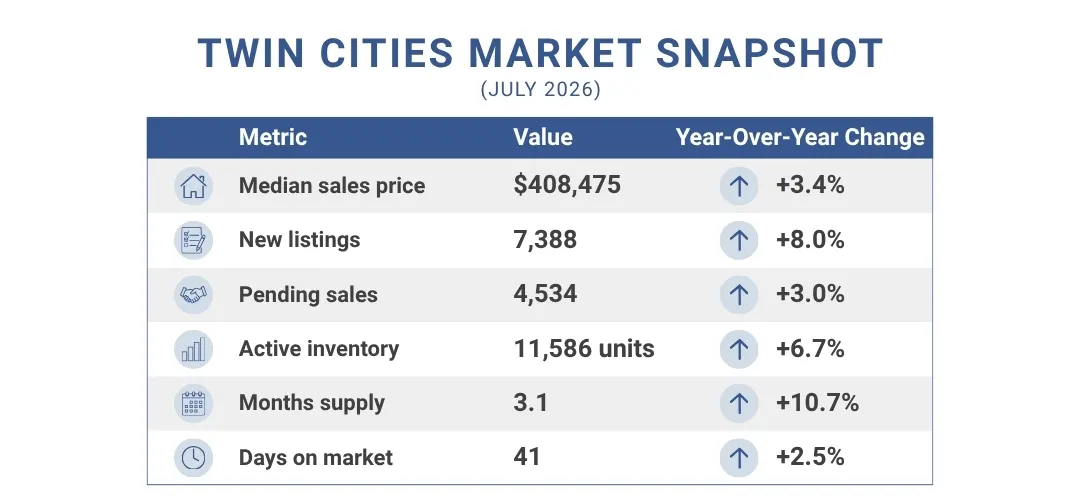
Source: Minneapolis Area Realtors Monthly Indicators report, July 2026, as revised in the MAAR Weekly Market Activity Report published September 14, 2026.
The most current weekly snapshot, for the week ending September 5, shows a shift as summer winds down. New listings pulled back 16.7% year over year to 1,335, reversing several weeks of gains, while pending sales rose 7.8% to 916 and inventory grew 10.1% to 11,879 units, though inventory has eased slightly from its late-August peak of roughly 12,057 units. It is an early signal the market may be settling into its usual fall rhythm rather than a definitive shift in either direction.
There is also a fresh macro-economic signal worth watching. The U.S. economy added 162,000 jobs in August, more than three times what forecasters expected, according to the Bureau of Labor Statistics, and residential construction alone added 7,300 positions as builders continue to work through housing supply. A labor market this resilient raises the odds the Federal Reserve holds rates steady or leans hawkish at its September meeting, one more reason buyers weighing when to lock in financing may not want to wait. We cover this dynamic in more depth in Should You Wait for Mortgage Rates to Drop?
This lines up with what we covered in our Mid-Year 2026 Housing Market Update and our earlier piece on how to tackle a balanced market: more inventory and steady, if modest, price growth rather than a runaway market in either direction. For a broader look at how this plays out at different budgets, see What Today’s Twin Cities Market Means for Buyers at Every Price Point.
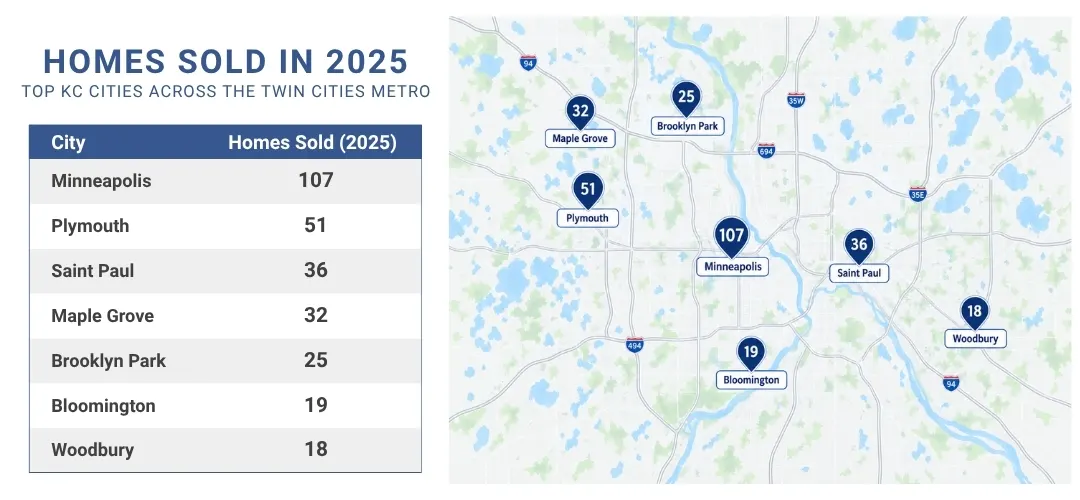
Our own footprint tells a similar story: activity spread across many cities rather than concentrated in one.
Top 2025 markets by homes sold: Minneapolis, Plymouth, Saint Paul, Maple Grove, and Brooklyn Park.
So far in 2026, Minneapolis, Plymouth, and Saint Paul remain our top three markets by volume, with Brooklyn Park and Maple Grove essentially tied for fourth.
A note on what this shows: these are transaction counts, not price appreciation. A city with a high sold count has strong activity and liquidity, which is valuable context, but it does not by itself tell us which city’s home values are climbing fastest. That is a separate, price-based metric that still requires city-level data to answer directly.
Takeaway: Twin Cities real estate activity is genuinely spread across the metro, not concentrated in Minneapolis or any single suburb. Minneapolis, Plymouth, Saint Paul, Maple Grove, and Brooklyn Park consistently represent our busiest markets, making them the most useful starting point once price data is layered in city by city.
Direct answer: We cannot yet name a single fastest-appreciating suburb with confidence. Volume data shows where deals are happening, not which prices are climbing fastest, and those are two different questions.
Answering this well takes two different metrics: how much activity a city sees, and how much its prices are actually moving.
What our volume data shows: Beyond the top five, our 2025 footprint included meaningful activity in Eden Prairie (12), Rogers (13), Crystal (13), Corcoran (9), Blaine (14), Lakeville (8), Chaska (8), and Otsego (14), among others. Our 2026 year-to-date numbers show a similar shape, with Eden Prairie, Otsego, Brooklyn Center, and Coon Rapids all in the 13 to 15 range so far this year, alongside newer names further out in the footprint like Corcoran and New Hope beginning to show up more consistently.
What the numbers suggest so far: High-volume cities like Minneapolis, Plymouth, and Saint Paul tend to have deep, liquid markets, which usually supports steadier price growth over time. Smaller-volume cities further out in the footprint, like Otsego or Corcoran, can sometimes see sharper percentage gains precisely because they are earlier in their growth curve, but we cannot confirm that without price data by city.
Direct answer: Local inventory levels, housing type, commute flexibility, price point, and buyer demographics are the main factors that typically drive one suburb to appreciate faster than another.
We want to be clear about what our data shows versus what is broader market context.
What our data can show: which cities in our footprint are appreciating fastest, how many of our 904 transactions occurred in each city, and how days on market and list-to-sale ratios varied by location.
Broader market factors that may help explain the differences:
We want to avoid drawing a straight line from any single factor to a specific city’s performance without the data to back it up. Our goal is to keep pairing our 904-transaction dataset with these broader trends so the picture stays grounded in what we are actually seeing on the ground.
Direct answer: Neither Minneapolis nor the suburbs is universally the better buy. The right choice depends on whether you are prioritizing affordability, long-term appreciation, or lifestyle fit.
In a market that is still competitive in pockets, your first offer matters more than most buyers realize. We cover the mechanics of that in House Hunting? Here’s Why Your First Offer Matters.
Because performance varies so much by city, we would rather walk through the specific numbers for the neighborhoods you are considering than make a general recommendation.
Direct answer: Rising new listings mean more competition, which puts a premium on accurate pricing and strong marketing rather than just listing and waiting.
Regionally, the newest weekly data (week ending September 5) shows new listings pulling back 16.7% year over year while pending sales rose 7.8%, a combination that can work in current sellers’ favor since fewer new competitors are entering the market just as buyer activity ticks up. That said, months supply is still up 10.7% year over year through July, so accurate pricing and presentation matter as much as ever, something we covered in Why Some Homes Sell Fast, and Others Sit on the Market, in Minnesota.
This is exactly where our marketing approach makes a measurable difference. Across our 904 transactions, our homes sold in 25 days on average versus 50 days for the market, and at 101% of asking price versus a 97.4% market average. That gap comes from 5.7 million-plus targeted ad impressions across Google and Facebook in 2025, professional photography and video on every listing, and direct outreach to our buyer database, not just a sign in the yard.
Minneapolis and the suburbs are not one market. They are dozens of smaller markets, each moving at its own pace, and the only way to know where home values are truly growing fastest in 2026 is to look city by city rather than relying on a single metro-wide number.
Our 904 transactions across 21 cities give us a closer look at that variation than broad regional statistics can offer on their own. Whether you are trying to figure out where your dollar goes furthest as a buyer, or how to position your home as a seller, the answer depends on the specific city, and even the specific neighborhood, you are looking at. It is also why buyers and sellers searching for the best realtor in Minneapolis tend to look for a team that tracks data at the city level rather than one relying on metro-wide averages alone.
If you want a breakdown of how your city, or one you are considering, has actually performed based on real local transaction data, reach out and we will walk through the numbers with you.
There is no single right answer. It depends on the specific city, your budget, and what you are prioritizing: appreciation potential, commute, lot size, or affordability. City-level data matters more than a general Minneapolis vs. suburbs comparison.
No single suburb can be confirmed as the fastest-appreciating without city-by-city price data. Volume data shows Minneapolis, Plymouth, and Saint Paul as the busiest markets, while smaller suburbs like Otsego and Corcoran show signs of earlier-stage growth. This varies by city and changes over time.
It remains fairly balanced with a gradual tilt toward buyers. Months supply reached 3.1 in July, up 10.7% year over year, and prices continue to climb modestly. The newest weekly data (week ending September 5) shows new listings pulling back 16.7% while pending sales rose 7.8%, suggesting the market may be leveling out rather than continuing to shift sharply in either direction.
Yes, for well-priced and well-marketed homes, and current conditions may work in sellers’ favor. The most recent week (ending September 5) showed new listings pulling back 16.7% year over year while pending sales rose 7.8%, meaning fewer new competitors and a pickup in buyer activity. Homes marketed well, like our listings that average 25 days on market versus the region’s 50, continue to perform strongly regardless of the broader inventory trend.
The median sales price was $408,475 as of July 2026, up 3.4% year over year, according to the Minneapolis Area Realtors Monthly Indicators report.
It is too early to say for certain, but the odds shifted after the August jobs report. The U.S. economy added 162,000 jobs, more than three times what forecasters expected, a resilient signal that raises the chance the Federal Reserve holds rates steady or leans hawkish at its September meeting rather than cutting further.