
Last updated: September 23, 2026 | Data: NorthstarMLS, rolling 12 months through August 2026
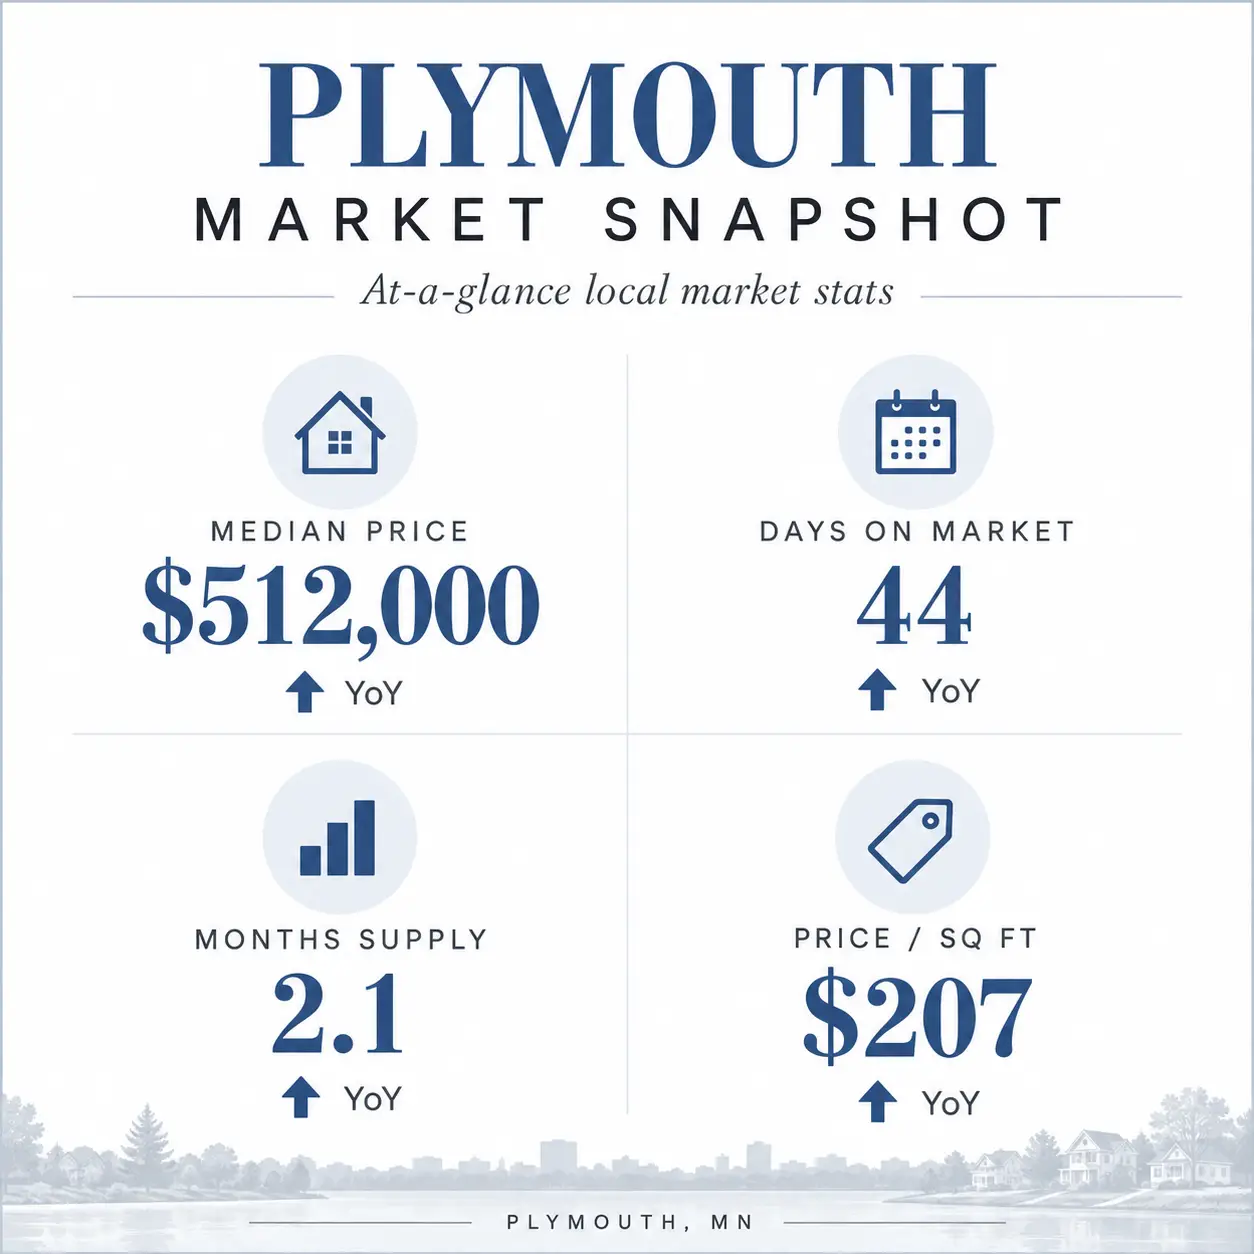
The Plymouth MN real estate market is still a seller's market in August 2026. The median home price is $512,000, up 1.8% from a year ago. Homes sell in an average of 44 days, 4.3% faster than last year, and supply is only 2.1 months. Price per square foot is flat at $207, which means Plymouth home values are steady rather than surging.
Plymouth is pricier, faster, and tighter than the Twin Cities as a whole. The table below compares Plymouth’s rolling 12-month figures with the same 12-month figures for the Twin Cities metro.
| Metric (12 months through Aug 2026) | Plymouth, MN | Twin Cities Metro | Plymouth vs. Metro |
|---|---|---|---|
| Median sales price | $512,000 +1.8% | $395,000 +1.5% | About $117,000 higher |
| Average days on market | 44 days -4.3% | 50 days +4.2% | 6 days faster |
| Months supply of inventory | 2.1 months +5.0% | 2.7 months +8.0% | Tighter |
| Median price per square foot | $207 0.0% | $217 +1.5% | About $10 lower |
| Active listings | About 190 (Sep 2026) | 11,698 (Aug 2026) | Not comparable |
Sources: NorthstarMLS; Minneapolis Area REALTORS® August 2026 Monthly Indicators. Metro days on market uses cumulative days on market (CDOM).
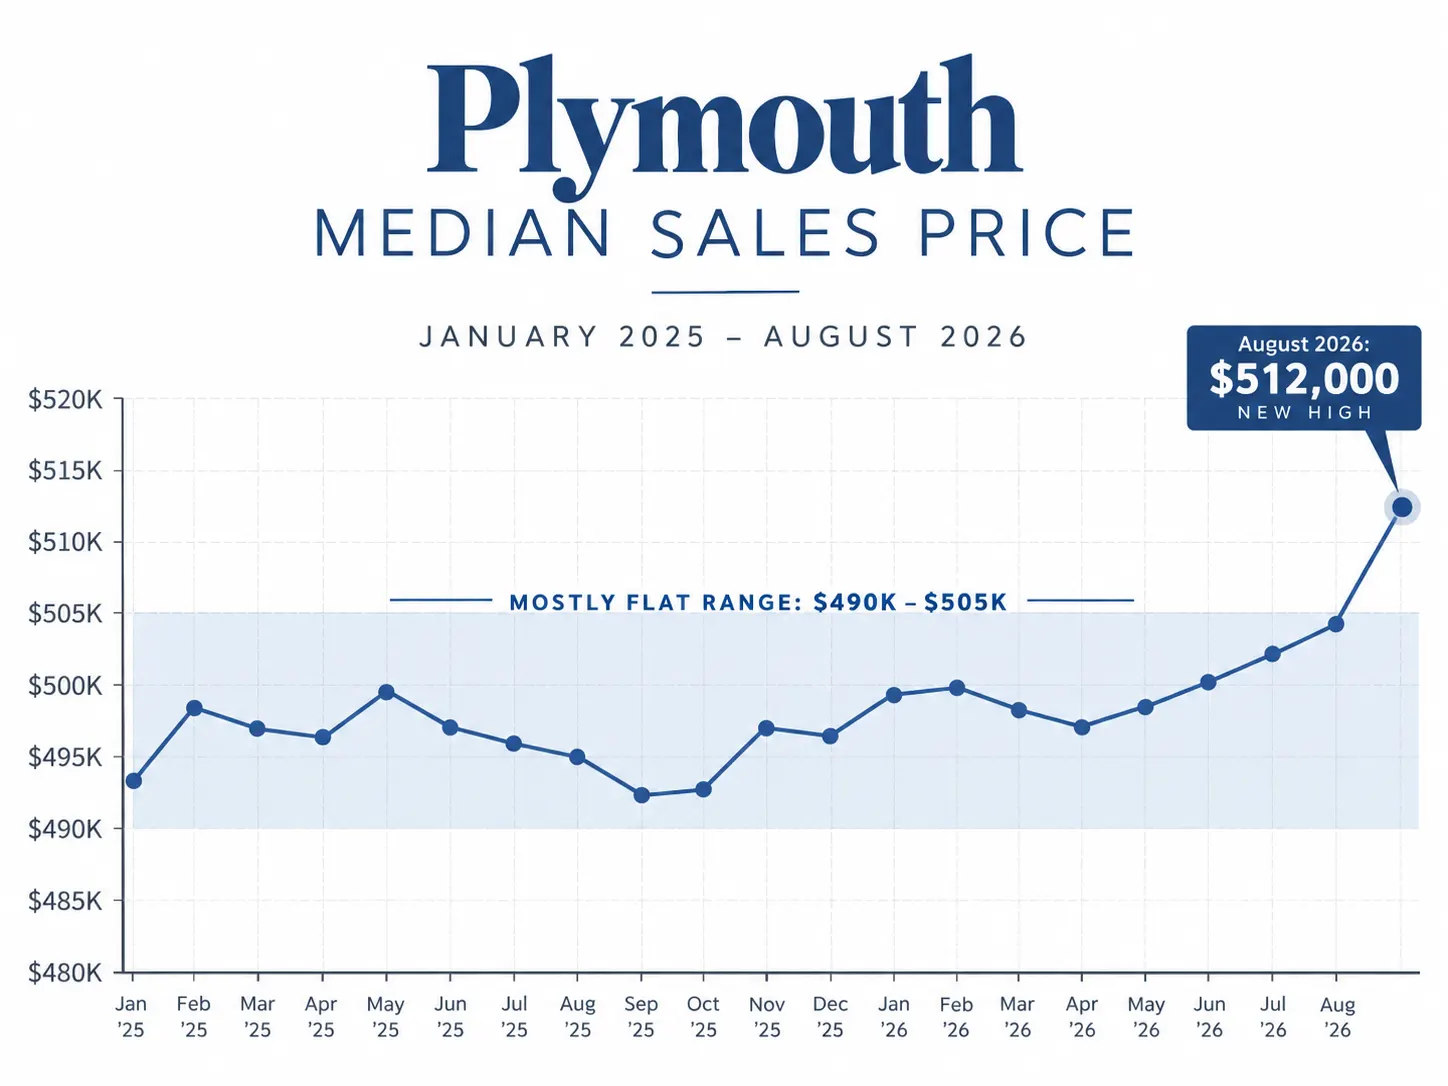
The median home price in Plymouth MN is $512,000 as of August 2026, up 1.8% from about $503,000 a year earlier. That is the highest level in the past 20 months and roughly 30% above the Twin Cities metro 12-month median of $395,000.
Plymouth’s median sat in a narrow band from about $490,000 to $505,000 from early 2025 through spring 2026. Then it broke higher:
For context, the metro’s August single-month median was $405,000 (+1.3%), and the statewide median was $370,000 (+2.8%). To see how Plymouth’s growth compares with other suburbs and the city, read our breakdown of where home values are growing in Minneapolis vs. the suburbs.
Plymouth home values are holding steady, not climbing fast. The median price rose 1.8%, but the median price per square foot stayed flat at $207.
When the median price rises while price per square foot stays flat, the gain usually comes from which homes sold (for example, more larger homes) rather than every home gaining value. Here is what that means:
Plymouth’s $207 per square foot sits below the metro’s $217 because Plymouth homes tend to be larger, and bigger homes usually carry a lower cost per square foot.
Plymouth MN has about 190 homes for sale and 2.1 months of supply, up slightly from 2.0 months a year ago. That means if no new listings came on the market, current inventory would sell out in about two months.
What is months of supply? Months of supply is the number of active listings divided by the average number of homes that go under contract each month. It is the quickest way to tell who has the advantage:
| Months of Supply | Market Type |
|---|---|
| Under 3 months | Seller’s market |
| 3 to 6 months | Balanced market |
| Over 6 months | Buyer’s market |
Plymouth held at 2.0 months from mid-2025 into spring 2026 and moved to 2.1 months in June 2026. Across the region, supply is growing faster:
Plymouth buyers are seeing a little more choice, but much less than buyers elsewhere in the metro. For a deeper look at what a shifting market means for each side, see our guide on how to tackle a balanced market as a buyer or seller.
Homes in Plymouth MN sell in an average of 44 days, down 4.3% from 46 days a year ago. Plymouth is getting faster while the broader market slows down.
| Area | Average Days on Market | Year-over-Year Change |
|---|---|---|
| Plymouth | 44 days | Down 4.3% |
| Twin Cities metro (August) | 45 days | Up 7.1% |
| Minnesota statewide (August) | 51 days | Up 6.3% |
Plymouth’s average ran between 45 and 47 days for most of 2025, then fell to 44 days in June 2026 and 43 days in July, its lowest level in nearly two years.
Why do you see different “days on market” numbers? The average includes every sale, so a few homes that sit for months pull the number up. The median shows the typical home, which is why our recent post on whether Plymouth is a buyer’s or seller’s market reports a much shorter 22-day figure. Both point to the same conclusion: well-priced Plymouth homes sell quickly.
What this means for you:
Plymouth MN is a moderate seller’s market in 2026. Supply is 2.1 months, homes are selling faster than last year, and the median price is at a 20-month high. Flat price per square foot and higher mortgage rates are keeping it from overheating.
| Factor | Favors Sellers | Favors Buyers |
|---|---|---|
| 2.1 months of supply | Yes | — |
| Days on market falling to 44 | Yes | — |
| Median price up 1.8% | Yes | — |
| Price per sq ft flat at $207 | — | Yes |
| Mortgage rates near 6.95% | — | Yes (less competition) |
| Rising metro inventory | — | Yes |
Across the metro, sellers received 98.2% of their original list price in August, down from 98.8% a year earlier, so there is slightly more room to negotiate than last year. For the full buyer vs. seller breakdown, including sale-to-list ratios and showings data, read Is Plymouth, MN a Buyer’s or Seller’s Market in 2026?
Rising mortgage rates are slowing buyer demand across the Twin Cities, but Plymouth’s higher price range is holding up better. According to Freddie Mac, rates climbed to about 6.95% in mid-September 2026, up from 6.66% three weeks earlier. The Federal Reserve also raised its benchmark rate for the first time in more than three years.
The regional impact so far:
That upper-end strength matters in Plymouth, where the median is above $500,000 and many buyers bring more equity or cash. If you’re shopping at the top of the market, see our look at Twin Cities luxury homes that made a statement.
Buyer tip: Ask your lender about rate-lock options now. Our post on whether you should wait for mortgage rates to drop shows what waiting cost Twin Cities buyers last year.
Plymouth stays tighter and pricier than the metro because steady demand meets limited supply in a mostly built-out suburb. These local factors drive that demand:
Local proof point: A well-prepared, correctly priced listing still wins big here. We recently saw a Plymouth condo sell $26,000 over list price in just one day.
Plymouth sellers should price accurately and list before the seasonal slowdown, and buyers should get pre-approved and move decisively on the right home.
Steps for Plymouth sellers:
Steps for Plymouth buyers:
For a price-point view of the whole region, read what today’s Twin Cities market means for buyers at every price point.
The Plymouth MN real estate market remains a moderate seller’s market in August 2026, with a $512,000 median price (+1.8%), 44 average days on market, and just 2.1 months of supply. Values are steady rather than surging, and rising mortgage rates are cooling the wider region, so pricing and strategy matter more than ever.
Kerby & Cristina Real Estate Experts is headquartered right here in Plymouth and tracks this market block by block. As the #1 REMAX Results Team in Minnesota, with 904 homes sold for $353M+ in 2025, we can show you exactly where your home or target neighborhood stands today.
The median home price in Plymouth MN is $512,000 as of August 2026, up 1.8% from a year earlier. That is about $117,000 above the Twin Cities metro 12-month median of $395,000.
Homes in Plymouth MN sell in an average of 44 days, down 4.3% from 46 days a year ago. The typical (median) well-priced home sells even faster.
Plymouth has about 190 homes for sale and 2.1 months of supply. That is tighter than the Twin Cities metro and well under the 3-month mark that would signal a balanced market.
Plymouth MN is a moderate seller’s market, based on 2.1 months of supply and falling days on market. Flat price per square foot and higher mortgage rates are keeping conditions from overheating.
August 2026 data shows no sign of falling prices in Plymouth. The median reached $512,000, and price per square foot held at $207, supported by tight supply.