
Is now a good time to sell a house in St. Paul, MN? Yes, for sellers who price accurately and prepare their home well. St. Paul homes are still going under contract in roughly three weeks on average, and the typical home is holding its value. But St. Paul sales activity fell 12.6% year over year in August 2026 while inventory improved, so buyers have more choices and more leverage than they did a year ago.
How long will it take to sell my house in St. Paul? Most well-priced St. Paul homes go pending in about 19 days, according to Zillow data through August 2026, and InfoSparks puts St. Paul’s median days on market at 21 days. Kerby & Cristina listings sell in a team average of 25 days, compared to 45 days across the Twin Cities metro in August 2026.
The short version for St. Paul sellers:
If you want the number for your exact street, request a free St. Paul home evaluation and our team will pull it for you.
Comparing both sides of the river? Read our companion guide, Is Now a Good Time to Sell in Minneapolis?
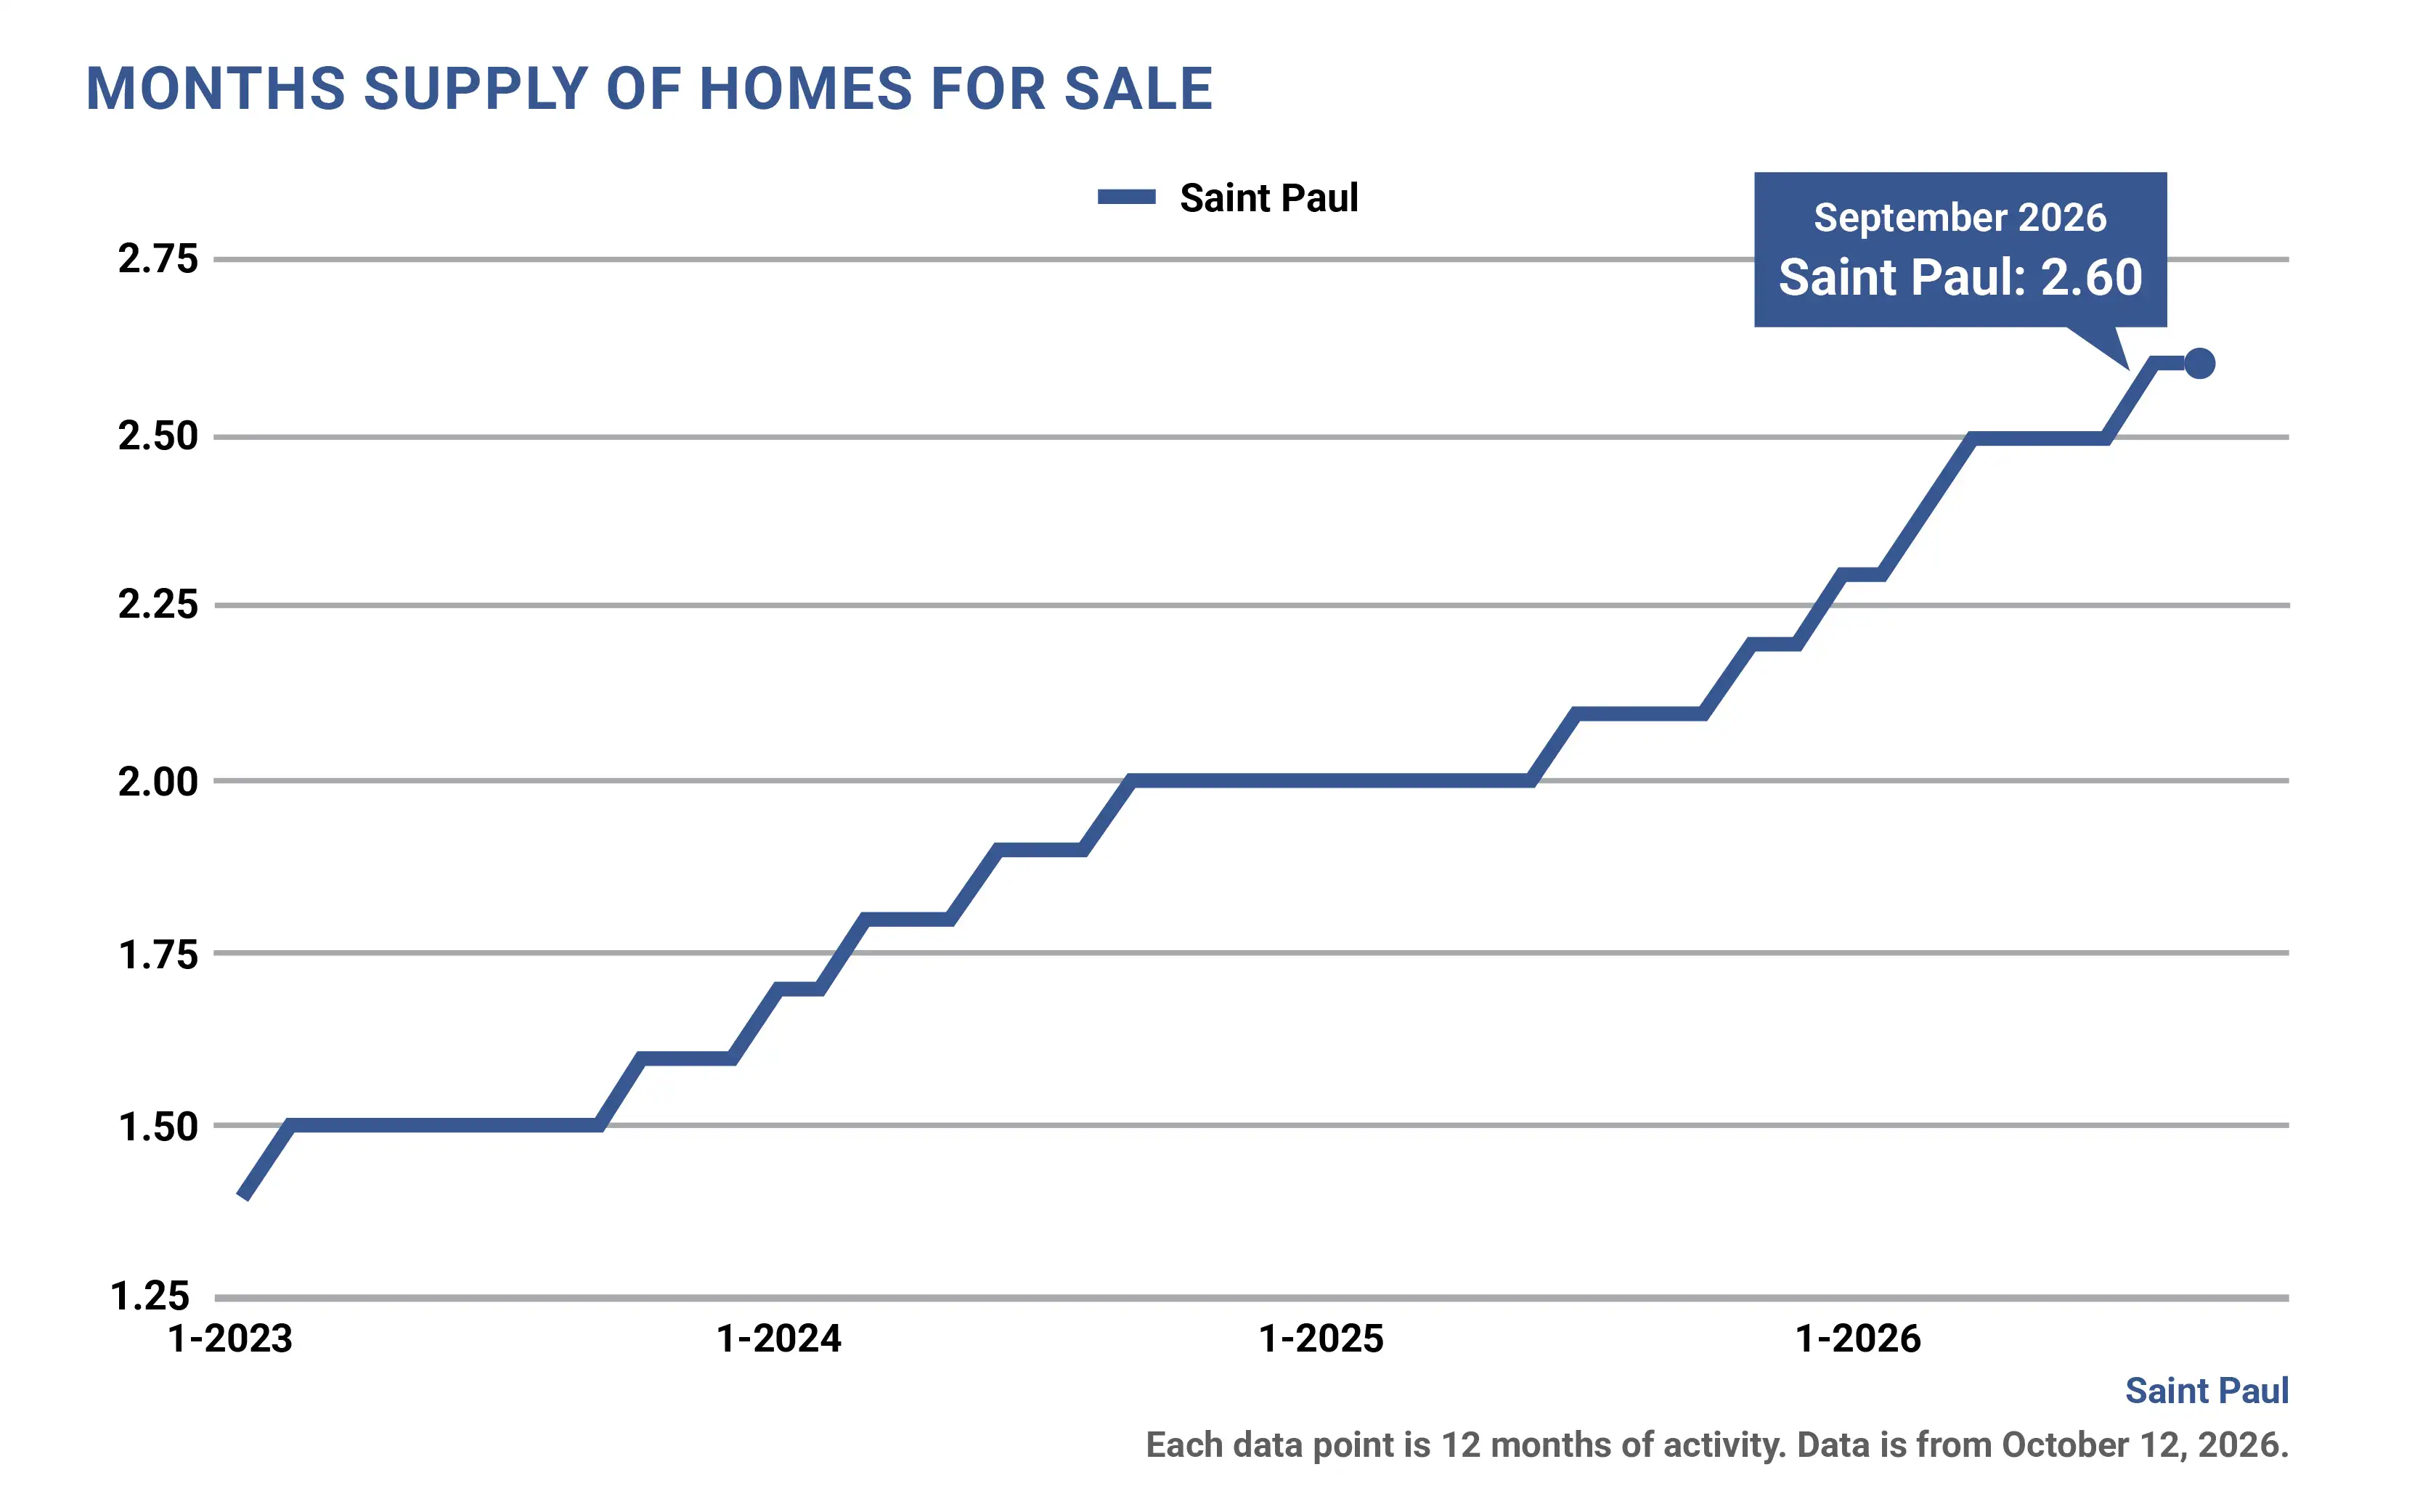
Yes, but St. Paul has shifted from a hot seller’s market toward a more balanced one, so pricing and presentation matter more than they did a year ago. St. Paul’s months supply of inventory sits at 2.6 months, up from 2.1 a year ago and 1.4 in early 2023. Under three months favors sellers, three to six months is balanced, and over six months favors buyers.
Here is how St. Paul compares to the broader market right now:
| Metric | St. Paul, September 2026 | St. Paul, September 2025 | Twin Cities Region, September 2026 |
|---|---|---|---|
| Median Sales Price | $300,000 | $300,000 | $395,000 |
| Percent of Original List Price Received | 98.7% | 99.4% | 98.4% |
| Months Supply of Inventory | 2.6 | 2.1 | 2.7 |
| Median Days on Market | 21 | 20 | 24 |
Source: InfoSparks (NorthstarMLS), rolling 12-month figures through September 2026.
St. Paul also has 581 homes for sale, its highest inventory since at least 2023, and recorded 2,638 pending sales over the past 12 months. Across the Twin Cities Region, those figures are 10,388 homes for sale and 46,489 pending sales.
St. Paul is still a seller’s market at 2.6 months of supply, but it is loosening, up from 2.1 months a year ago. Statewide, August 2026 was the most balanced August since 2017. The Saint Paul Area Association of REALTORS noted that St. Paul sales are running below last year even as inventory improves, which means more competition among sellers for each buyer.
St. Paul home values are holding steady, not falling. Zillow puts the typical St. Paul home value at $294,297 as of August 2026, up 0.8% from a year ago. InfoSparks shows a St. Paul median sales price of $300,000, essentially unchanged from a year ago, after peaking near $305,000 in early 2026. The Twin Cities Region median is $395,000.
Flat to modest price growth with rising inventory is exactly the market where a sharp pricing strategy separates homes that sell quickly from homes that sit. For a deeper look at how balanced conditions change the playbook, read how to tackle a balanced market.
The average time to sell a house in St. Paul is about three to six weeks from listing to accepted offer, plus roughly 30 to 45 days to close. St. Paul’s median days on market is 21 days, compared to 20 days a year ago and 15 days in early 2023. Zillow data through August 2026 shows St. Paul homes going pending in around 19 days.
St. Paul homes spend a median of 21 days on market, a bit faster than the Twin Cities Region median of 24 days. Both are up from a year ago as inventory grows and buyers take more time to decide. Averages run longer than medians because a few slow sales pull them up: metro homes averaged 45 days on market in August 2026.
Kerby & Cristina listings sell in a team average of 25 days, compared to 45 days for the broader Twin Cities market in August 2026. Averaging methods differ between our internal numbers and regional reporting, so read the comparison as directional. The direction is consistent, though: our listings move faster than the market around them.
For a side-by-side look at how timelines vary across the river, see how long it takes to sell a house in Minneapolis by neighborhood.
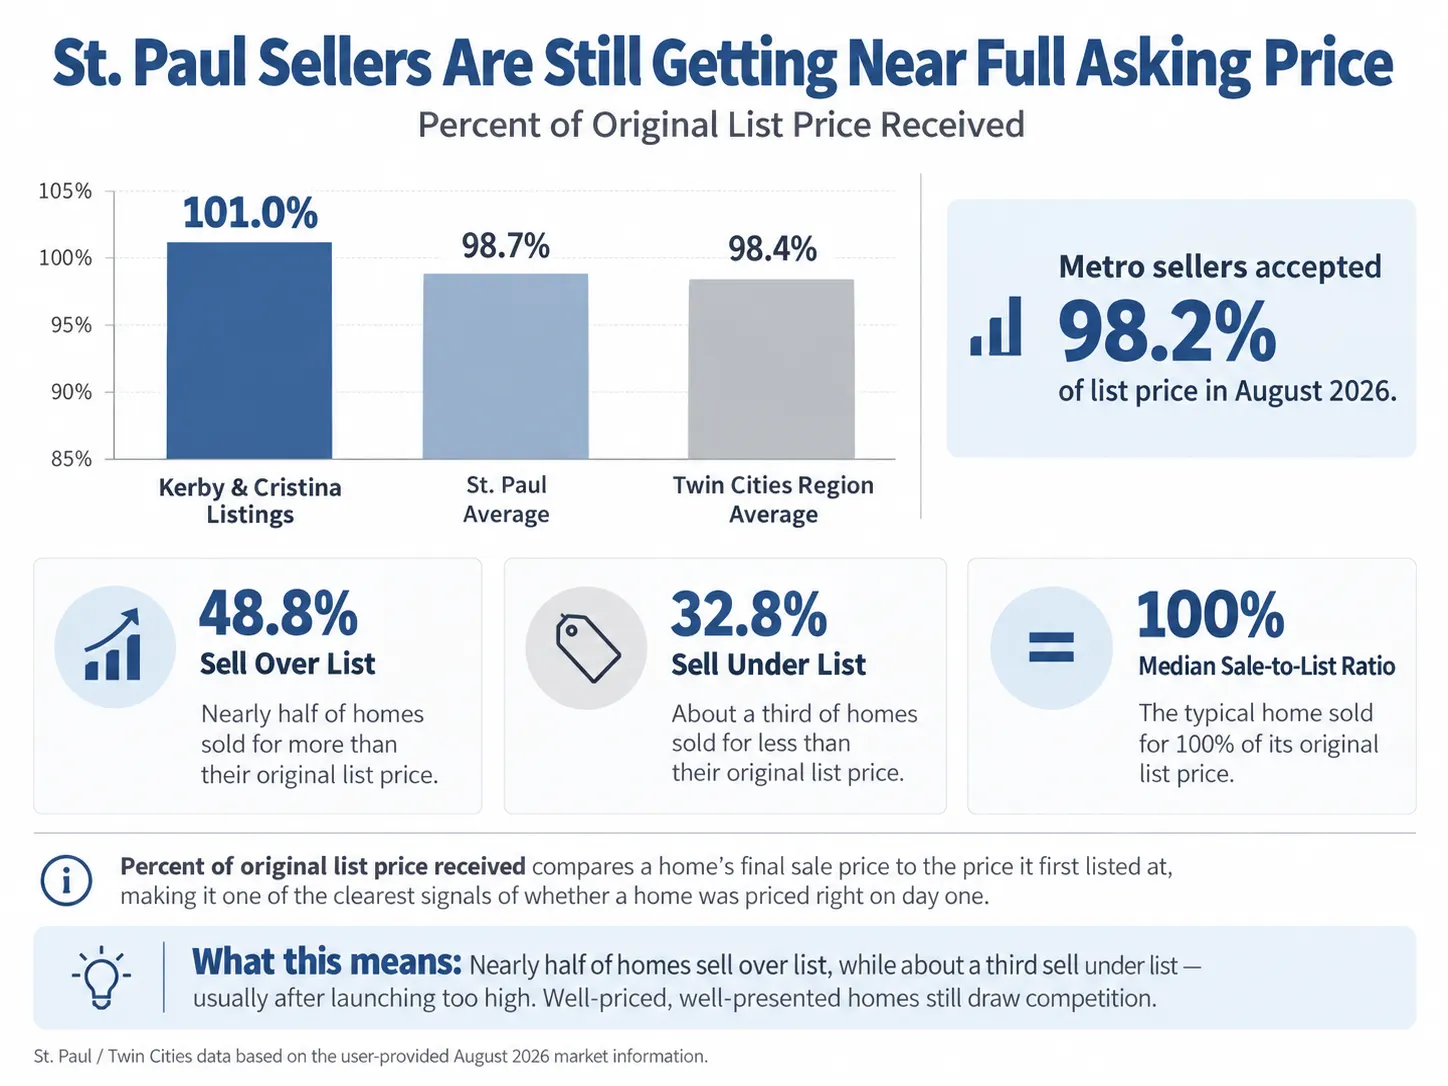
Most St. Paul sellers are getting close to full asking price: 98.7% of original list price received, on average, versus 98.4% across the Twin Cities Region. Zillow data through August 2026 shows a median sale-to-list ratio of 100% in St. Paul, with 48.8% of homes selling over list and 32.8% selling under.
Percent of original list price received compares a home’s final sale price to the price it first listed at, so it captures any price cuts along the way. It is one of the clearest signals of whether a home was priced right on day one.
What this means for St. Paul sellers:
Kerby & Cristina listings close at 101% of asking price, compared to 97.4% market-wide. Our recent Lake Elmo listing that sold $50,100 over list with a full appraisal waiver shows what that looks like in practice.
Price point, pricing accuracy, condition and marketing decide how fast a St. Paul home sells, more than the calendar does. Two homes on the same block can sell weeks apart based on these four factors alone.
In St. Paul, homes priced $400,000 to $1 million sell fastest, at a median of 12 days, while homes under $250,000 take the longest at 35 days. The entry-level segment has loosened the most: months supply under $250,000 jumped from 2.2 to 3.6 since early 2025, while the $400,000 to $599,999 range is still the tightest at 1.9 months.
| St. Paul Price Range | Median Days on Market | Months Supply |
|---|---|---|
| $249,999 or less | 35 | 3.6 |
| $250,000 to $399,999 | 19 | 2.3 |
| $400,000 to $599,999 | 12 | 1.9 |
| $600,000 to $1,000,000 | 12 | 2.7 |
| All price ranges | 21 | 2.6 |
Source: InfoSparks, St. Paul, rolling 12 months through September 2026.
What this means for sellers by price point:
Selling a St. Paul home over $600,000? Our luxury listing services are built for that buyer pool.
Pricing right on day one is the single biggest driver of a fast sale. Homes that launch too high collect days on market and price cuts, which lowers the final percent of list price received. Buyers watch new listings closely in the first two weeks, so that window is when your home has the most leverage.
Move-in-ready homes sell faster and for more. St. Paul’s housing stock skews older, so updated mechanicals, fresh paint and clean inspections stand out. Our post on why the best marketing makes buyers feel your home’s story explains why presentation matters even more when buyers have choices.
Homes seen by more qualified buyers sell faster. Every Kerby & Cristina listing gets professional architectural photography and video, targeted Google, Facebook and Instagram campaigns, and direct distribution to our buyer database, which generated more than 5.7 million ad impressions in 2025.
If your home is ready, selling this fall or winter means less competition from other sellers; waiting for spring means more buyers but also more listings. St. Paul recorded 2,638 pending sales over the past 12 months, holding roughly steady, while homes for sale climbed to 581. Buyers are still signing contracts; they simply have more homes to choose from.
Spring traditionally brings the largest pool of St. Paul buyers. Fall and winter buyers tend to be more serious, and fewer competing listings can help your home stand out. If you list in the colder months, plan ahead: our guide on why fall sellers should get green photos now explains how.
Waiting on rates is a gamble, because lower rates usually bring more buyers and more competing sellers at the same time. Mortgage rates remain elevated heading into fall 2026, and the outlook is uncertain. Read what waiting for rates cost Twin Cities buyers last year before you decide.
St. Paul is not one market: Como Park, Macalester-Groveland and Highland Park are still tight seller’s markets, while Summit Hill and the East Side neighborhoods are loosening toward balance. Months supply ranges from 1.3 in Como Park to 3.0 in Summit Hill, and the share of original list price received ranges from 97.0% to 101.5%.
| St. Paul Neighborhood | Months Supply | % of Original List Price Received | Market Read |
|---|---|---|---|
| Como Park | 1.3 | 101.5% | Strong seller’s market |
| Macalester-Groveland | 1.5 | 100.0% | Strong seller’s market |
| Highland Park | 1.8 | 99.9% | Seller’s market |
| Hamline-Midway | 1.8 | 99.6% | Seller’s market |
| Dayton’s Bluff | 2.4 | 97.0% | Seller’s market, softer pricing |
| North End | 2.8 | 98.8% | Seller’s market, loosening |
| Payne-Phalen | 2.9 | 98.1% | Seller’s market, loosening |
| Summit Hill | 3.0 | 97.8% | Balanced |
Source: InfoSparks, rolling 12 months through September 2026. Smaller neighborhoods trade in lower volume, so treat their figures as directional.
What we are seeing on the ground:
New to the area or comparing both cities? Our guide to Twin Cities neighborhoods and Minneapolis vs. suburbs home value comparison add helpful context.
Now is a good time to sell a house in St. Paul if you price it right and present it well. Values are steady, well-priced homes still go pending in about three weeks, and nearly half of St. Paul homes sell over list. With inventory rising and sales slowing, the right strategy matters more than the right month.
That is where a St. Paul real estate agent with a proven marketing engine makes the difference. Kerby & Cristina is the No. 1 REMAX Results Team in Minnesota, closing 904 homes for more than $353 million in 2025, with listings that sell in 25 days on average at 101% of asking.
Thinking about selling in St. Paul? Get a neighborhood-specific read on your home’s value and timing with a free home evaluation, browse our recently sold homes, or call Kerby & Cristina at 763-634-0073.
Yes, for well-priced, move-in-ready homes. St. Paul home values are holding steady and homes go pending in about 19 days, but rising inventory means buyers have more choices, so pricing and presentation matter more than last year.
St. Paul homes spend a median of 21 days on market, then typically take another 30 to 45 days to close. Kerby & Cristina listings sell in a team average of 25 days, compared to a 45-day average across the metro.
St. Paul is still a seller’s market at 2.6 months of supply, up from 2.1 a year ago. Inventory is rising and sales were down 12.6% year over year in August 2026, so the market is shifting toward balance.
No. The typical St. Paul home value is $294,297, up 0.8% from a year ago according to Zillow, and the InfoSparks St. Paul median sales price is $300,000, flat year over year.
Price it accurately from day one, handle repairs before listing, invest in professional photography, and work with a team that markets directly to active buyers. Those steps help Kerby & Cristina listings sell faster and closer to asking than the market average.