

Should I Sell My Minneapolis Home Right Now?
It depends entirely on your neighborhood, not the city as a whole. Minneapolis does not have one housing market. It has a dozen small ones, and some are moving at completely different speeds just a few blocks apart.
• Sell now with confidence if you're in Longfellow (1.1 months of supply), Nokomis (1.2 months), Central (1.6 months), Northeast Minneapolis (1.6 months), or Fulton (2.0 months). These are tight seller's markets where homes are selling at or above asking price.
• You can still sell well, but expect more work if you're in Linden Hills (3.0 months), Powderhorn (2.5 months), Camden (2.6 months), or Near North (3.1 months). These are balanced or balanced-leaning markets.
• Plan for negotiation and a longer runway if you're in North Loop (6.6 months) or Whittier (4.6 months). Both have shifted into buyer's-market territory.
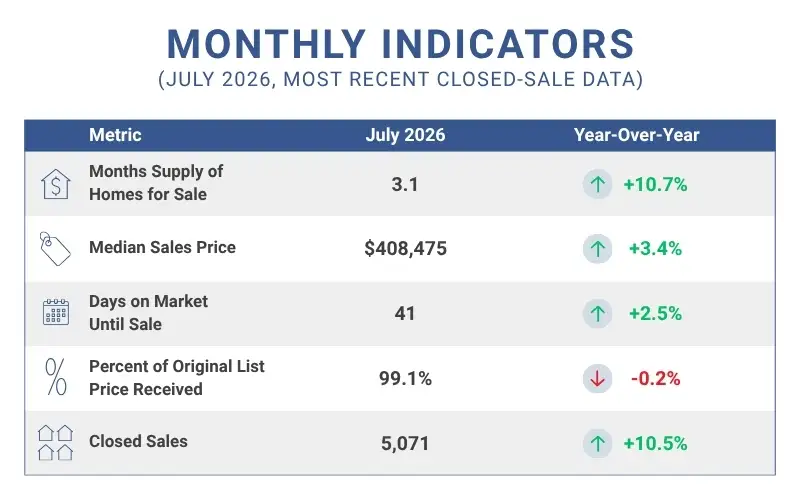
Metro-wide, supply is loosening (3.1 months, up 10.7% year over year), but homes are still moving fast: 41 days on market on average and 99.1% of original list price received.
If you want the full breakdown by neighborhood, keep reading. If you just want a straight answer for your specific block, talk to a local Minneapolis real estate team who can pull the number for your exact street.
Months of supply measures how long it would take to sell every home currently listed in an area, at the current pace of sales. It is the single best number for answering “is now a good time to sell,” because a citywide average blends together neighborhoods that can be moving at completely different speeds in the same month.
Here’s how to read it:
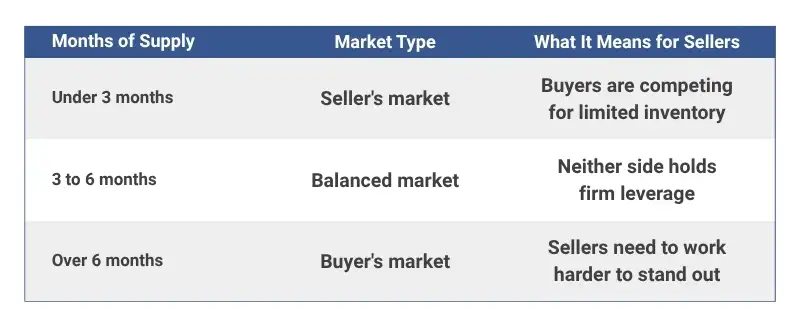
As you’ll see below, some Minneapolis neighborhoods are sitting under a month and a half of supply right now, while others have crossed fully into buyer’s-market territory. A single metro-wide number cannot capture that range, which is exactly why we break it down block by block below.
Metro-wide, Minneapolis remains a mild seller’s market overall, but it’s loosening. Here’s the latest data from NorthstarMLS, provided by Minneapolis Area REALTORS®.
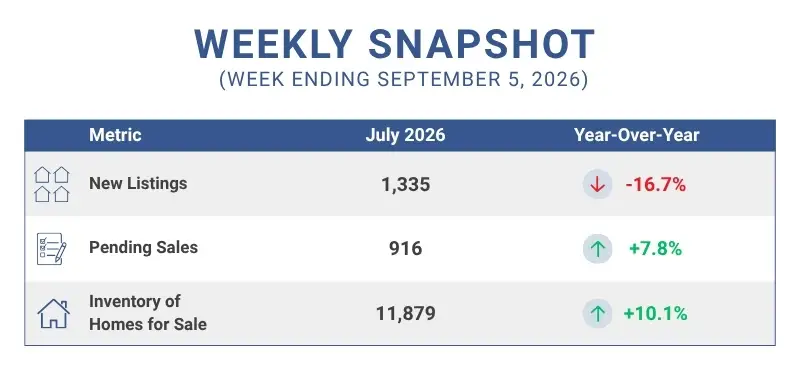
New listings pulled back sharply the week of Labor Day, which is a normal seasonal pattern, not a warning sign. Pending sales and inventory are both still running ahead of last year. For more on what this seasonal shift means for timing your listing, see what Twin Cities sellers need to know before listing this fall.
Broader context worth knowing: The U.S. economy added 162,000 jobs in August, more than three times what forecasters expected, according to the Bureau of Labor Statistics. That’s a sign of a resilient job market, but it also raises the odds the Federal Reserve moves on rates at its September meeting. Meanwhile, the Housing Affordability Index has slipped to 115, down 2.5% from a year ago, meaning buyers have a bit less purchasing power than they did last July. If you’ve been on the fence about whether to sell now or wait, that combination of factors is worth weighing. We cover it in more depth in should you wait for mortgage rates to drop?
Inventory is loosening slightly compared to a year ago, which is exactly why the neighborhood-level number matters more now than it did during the tightest years of the market. The neighborhood figures below come from a rolling twelve-month InfoSparks calculation, so they won’t match the single-month regional figures above exactly. What they do show clearly is that supply is spreading unevenly across the metro. For more on the broader shift, see our mid-year 2026 Twin Cities housing market update and how to tackle a balanced market.
If you’d like a neighborhood-level orientation before diving into the numbers, our guide to Twin Cities neighborhoods is a helpful companion piece.
Verdict: Still a strong seller’s market, though buyers have more breathing room than a year ago.
Linden Hills remains one of the tightest, most in-demand pockets of southwest Minneapolis. A months-of-supply reading of 3.0 sits right at the boundary between a seller’s market and a balanced one, even after a meaningful increase from a year ago.
Bottom line for sellers: At 3.0 months of supply and a list-to-sale ratio near 99%, well-priced homes are still moving with real competition behind them. Sellers who prepare their home well and price it accurately are still seeing multiple-offer outcomes here.

Verdict: Solidly a seller’s market.
Fulton sits right alongside Linden Hills in buyer demand, and at 2.0 months of supply it’s running noticeably tighter, well under the regional benchmark of 2.6 months.
Bottom line for sellers: Even with a real year-over-year increase in supply, two months of inventory means qualified buyers are still competing for a limited number of homes. A list-to-sale ratio near 99% shows they’re willing to pay close to asking price to win.
Verdict: A buyer’s market. Sellers need a stronger strategy here.
North Loop tells a very different story than the neighborhoods above it. At 6.6 months of supply, roughly two and a half times the regional benchmark of 2.6 months, this market has moved into buyer’s-market territory. North Loop is also condo-heavy, so supply is concentrated in a smaller number of buildings. Conditions can vary meaningfully between an older converted warehouse and a newer construction tower, even within the same neighborhood.
Bottom line for sellers: Expect more negotiation room and a longer runway to a signed contract. A list-to-sale ratio under 96% reflects that shift. This is a market where professional positioning, pricing strategy, and building-specific knowledge matter more than in a tighter neighborhood, because buyers here have options. For more on what today’s conditions mean depending on your price point, see what today’s Twin Cities market means for buyers at every price point.
Verdict: One of the tightest seller’s markets in the city.
Longfellow continues to draw buyers priced out of the lakes neighborhoods. At just over a month of supply, and actually tightening from a year ago while most of the city loosens, this is one of the most supply-constrained markets on this list. We’re using the broader Longfellow community figure here rather than a smaller neighborhood-only sample, since it reflects a larger, more statistically reliable pool of sales while telling the same story.
Bottom line for sellers: A list-to-sale ratio above 102% means Longfellow homes are routinely selling for more than their original asking price. With supply this tight, sellers who price thoughtfully are seeing real upward pressure from buyer demand rather than having to create it.
Verdict: One of the strongest seller’s markets in the city.
A note on sourcing, for transparency: Nokomis exists in InfoSparks only as a blended community-level figure rather than a standalone neighborhood filter, so the numbers above reflect the broader Nokomis community.
Bottom line for sellers: Even measured at the community level, Nokomis is holding at just over a month of supply with no loosening from a year ago, and homes are selling above their original list price. Sellers here are in a genuinely favorable position.

These three central Minneapolis neighborhoods are grouped together because they compete for a similar buyer pool and are best read side by side. All three carry lower annual sales volume than the lakes and southwest neighborhoods above, so treat these figures as directional trends rather than precise benchmarks.
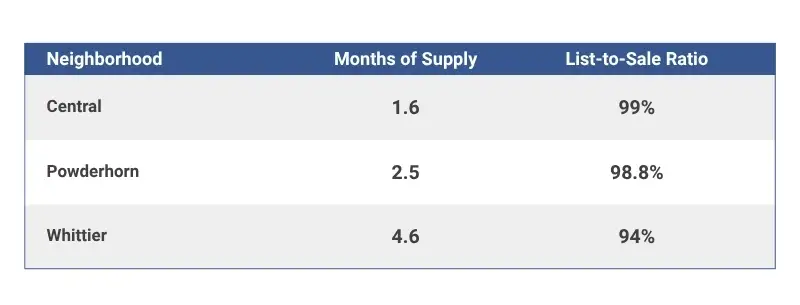
Bottom line for sellers: Central is the tightest of the three at 1.6 months of supply, with Powderhorn close behind at 2.5. Whittier stands apart, with supply nearing five months and a softer list-to-sale ratio, pointing to a market shifting toward balanced conditions faster than its neighbors. Sellers in Whittier should plan for more time on market and more room for buyer negotiation than sellers in Central or Powderhorn will typically see right now.
Verdict: Still a favorable seller’s market overall.
Northeast Minneapolis is tracked in InfoSparks as a blended community figure rather than by individual sub-neighborhood, with one exception. St. Anthony splits into separate filterable areas, but those areas trade in low enough volume, roughly nine to fourteen sales a year, that short-term figures there shouldn’t be read as reliable trend indicators.
Bottom line for sellers: Even with a meaningful year-over-year increase in supply, Northeast Minneapolis remains well under the regional benchmark of 2.6 months, keeping overall conditions favorable for sellers across the community.

Verdict: Balanced markets that have loosened significantly year over year.
Like Nokomis and Northeast, both Camden and Near North are tracked as community-level figures in InfoSparks rather than standalone neighborhood filters.
Bottom line for sellers: Camden and Near North are the two fastest-loosening markets in the city year over year. Camden now sits right at the regional benchmark, and Near North has moved slightly past it into balanced territory. Sellers in these communities should expect a more competitive listing environment than they would have found a year ago, even though supply levels are still reasonable in absolute terms.
Months of supply tells you what the market is doing. It doesn’t tell you what the right marketing strategy can do inside that market. That part comes down to execution, not just timing, and it’s where working with the best realtor in Minneapolis for your specific neighborhood makes a measurable difference.
Kerby & Cristina homes sell in a team average of 25 days, compared to 41 days for the broader Twin Cities market as of July 2026. We say this cautiously, because averaging methods differ enough between our internal numbers and regional reporting that the comparison should be read as directional rather than a precise multiple. The direction is consistent though: our listings move faster than the market around them.
Kerby & Cristina listings also close at 101% of asking price, compared to 97.4% market-wide. Every KC listing gets professional architectural photography and video, targeted Google, Facebook and Instagram campaigns rather than boosted posts, and direct distribution to our buyer database, which generated more than 5.7 million ad impressions in 2025 alone. Kerby & Cristina is the No. 1 RE/MAX Results Team in Minnesota and the No. 1 RE/MAX Luxury Team in Minnesota, having closed 904 homes for more than $353 million in 2025. You can see how that plays out in practice in a recent Lake Elmo listing that sold $50,100 over list with a full appraisal waiver.
In a tight-supply neighborhood like Fulton or Longfellow, that marketing engine turns a good market into a bidding-war market. In a neighborhood like North Loop or Whittier, where supply is loosening, it’s the difference between a listing that sits and one that still moves in weeks rather than months. Presentation matters even more when the buyer pool is smaller. We wrote more about why in every home has a story, and the best marketing makes buyers feel it.
Curious what buyers are actually competing for right now? Read how to win in multiple offers to see the other side of this equation.
It depends on your neighborhood. Areas like Fulton, Longfellow, and Nokomis are still running under a month and a half of supply, which favors sellers. North Loop and Whittier have loosened into buyer’s-market or balanced territory, meaning sellers there need stronger pricing and marketing strategy to see the same results.
If you’re in a tight-supply neighborhood such as Longfellow, Nokomis, Central, Northeast Minneapolis, or Fulton, yes, current conditions favor sellers. If you’re in a looser market like North Loop or Whittier, you can still sell well, but you’ll need sharper pricing, staging, and marketing to compete for a smaller buyer pool.
Months of supply measures how long it would take to sell through all current listings in an area at the recent pace of sales. Under three months generally favors sellers, three to six months is considered balanced, and over six months favors buyers.
Based on current InfoSparks data, Longfellow, Nokomis, and Central are the tightest markets in the city, each running at roughly a month and a half of supply or less, with homes selling at or above asking price.
North Loop is currently running at 6.6 months of supply, which puts it in buyer’s-market territory. Sellers there should expect more negotiation room and a longer time on market than in tighter neighborhoods, and should lean on professional marketing to stand out in a condo-heavy, competitive segment.
The right answer depends on your neighborhood’s specific conditions, which is exactly why a locally embedded team matters. Kerby & Cristina is the No. 1 REMAX Results Team in Minnesota and No. 1 REMAX Luxury Team in Minnesota, with listings that sell faster and closer to full asking price than the broader market across every neighborhood we serve.
Kerby & Cristina pairs professional photography and video, targeted digital advertising, and a large buyer database with neighborhood-level market knowledge, so sellers get both an accurate read on their specific market and the marketing engine to outperform it.
Thinking about listing? Get a neighborhood-specific read on your home’s value and timing with a free home evaluation, or call Kerby & Cristina at 763-634-0073.