

Last updated September 17, 2026, using the MAAR Weekly Market Activity Report published September 14, 2026 (data through September 5, 2026).
Citywide, Minneapolis homes sold at a median of $408,475 in July 2026 (the most recent closed-sales data), up 3.4% year over year, with homes going pending in 41 days and sellers netting 99.1% of original list price. That number is a blend, though. Linden Hills is running $376 per square foot right now while Central, three miles away, is at $166 per square foot. Your home's actual value depends on your neighborhood, your block, and what's currently competing with you, which is what the breakdown below is for. The fastest way to get your exact number is a comparative market analysis from a local agent, not an automated estimate.
The job market just came in stronger than expected, mortgage rates haven’t moved much, and Minneapolis inventory keeps climbing even as buyers keep showing up. None of that changes what your specific home is worth, but it shapes how fast it will sell and how much negotiating room buyers have.
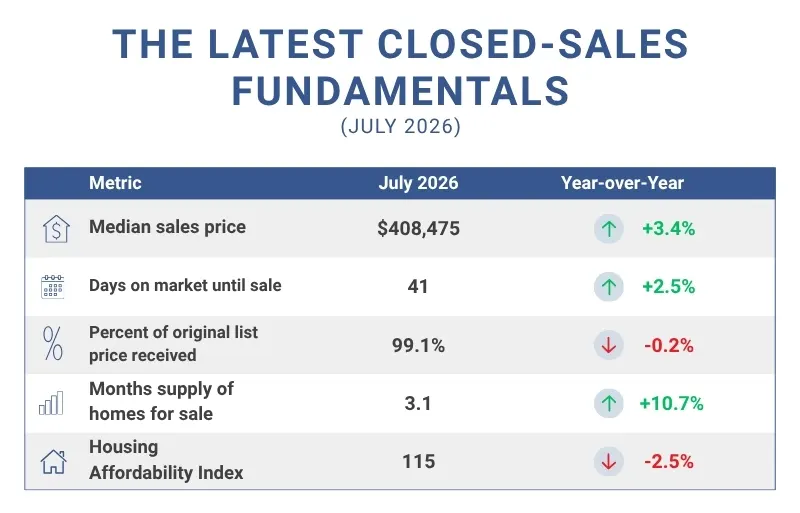
That last line matters more than it looks. The Affordability Index has slid from 120 in July 2024 to 118 in July 2025 to 115 now, meaning the same household income buys proportionally less home than it did two years ago, even in a market where price growth (3.4%) sounds modest. Rising prices plus rates that have barely budged are quietly squeezing buying power. If you’re weighing whether to wait for rates to drop before buying or listing, we broke down exactly what that wait cost buyers last year: the 30-year fixed rate barely moved between August 2025 and August 2026, while prices kept climbing.
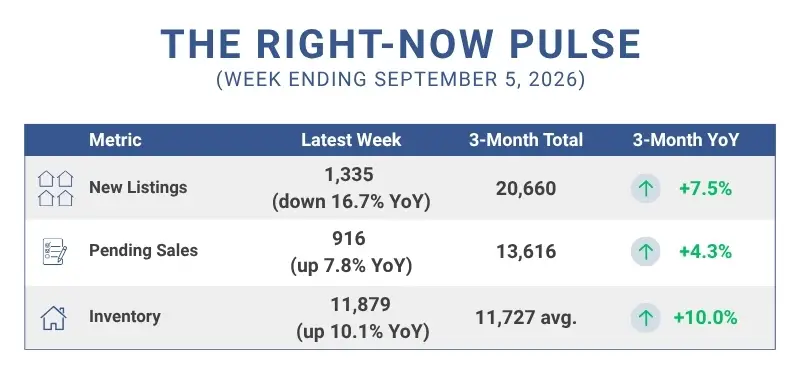
New listings pulled back sharply in the most recent week, typical for early September as the fall market resets, but the three-month trend is still running well above last year. Inventory has grown for ten straight months on a year-over-year basis, which is the clearest sign this market has loosened since the tight-supply years, even though it’s still below the 5 to 6 months considered balanced. If you want the fuller context on what that shift means depending on whether you’re buying or selling, our Mid-Year 2026 Housing Market Update and How to Tackle a Balanced Market both go deeper.
The U.S. economy added 162,000 jobs in August, more than three times what forecasters expected, with upward revisions to prior months and 7,300 of those jobs in residential construction. A labor market that strong makes it more likely the Federal Reserve holds or raises rates at its September meeting rather than cutting, which is one more reason buyers weighing a purchase shouldn’t assume rates are headed down soon. See What Today’s Twin Cities Market Means for Buyers at Every Price Point for how that plays out at different budgets.
A citywide median blends everything from a two-bedroom bungalow in Camden to a rebuilt lake-adjacent home in Linden Hills. Five things move your specific number more than that blend does:
We pull Infosparks data before every listing appointment specifically to filter comps down to your neighborhood, radius, price band, and even school district, rather than relying on a citywide average.
(Neighborhood-level figures below are the live Infosparks pull from July 2026, the most recent available; they refresh quarterly.)
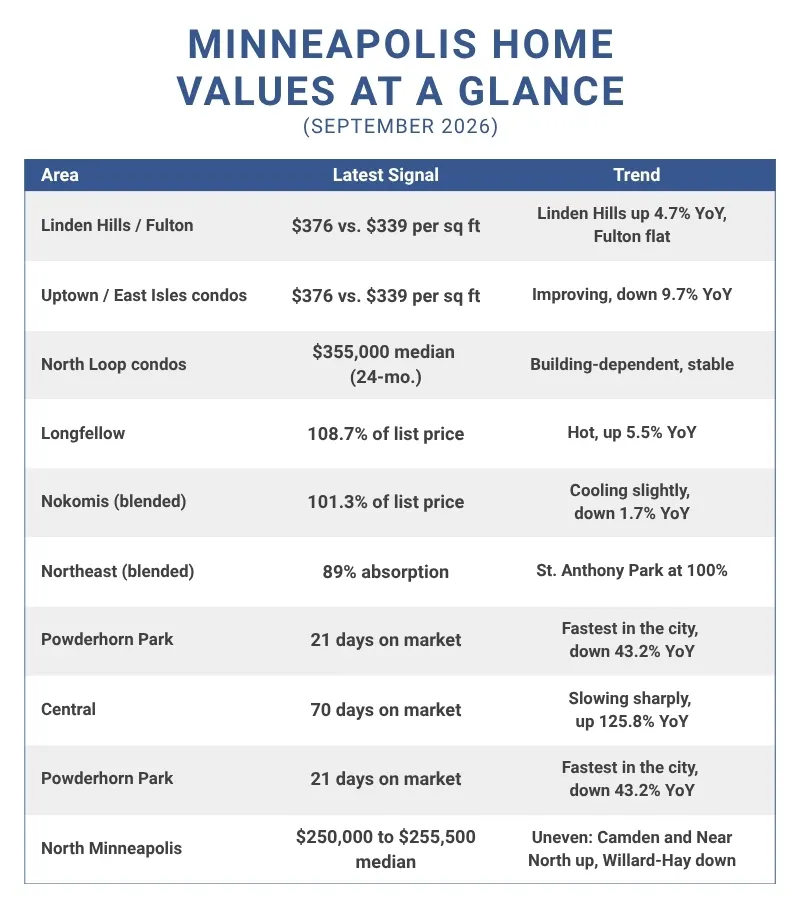
Linden Hills is running $376 per square foot (up 4.7% YoY) while neighboring Fulton sits at $339 (essentially flat, -0.3%), a roughly $37/sq ft gap between two neighborhoods that share a border. Chain of Lakes access, Fulton’s steady demand, and some of the city’s most sought-after school boundaries keep this corner of the city command the strongest premiums in Minneapolis proper. Well-presented homes are still getting multiple showings the first weekend, and turnkey homes near Lake Harriet regularly see competing offers. Kenwood, just north along Lake of the Isles, is another hyperlocal premium pocket; if you own there, ask us for a comp pull specific to your street rather than a Southwest Minneapolis average.
Condos in zip code 55408 are averaging 93 days on market, down 9.7% YoY, meaning absorption is actually improving, while single-family homes in the same zip are moving in 59 days, up 11.3% YoY. That’s a 34-day gap between property types in the same zip code. This area skews toward condos and walk-up multi-family conversions, and pricing has been more sensitive to interest rate movement than the lake-adjacent single-family pockets, since a larger share of buyers finance at higher loan-to-value ratios. If you own a condo here, pricing and marketing patience matter more than they would for a single-family listing three blocks away.
North Loop condos posted a median sold price of $355,000 on a trailing 24-month view. Pricing has stabilized after a few volatile years, with buyers now differentiating sharply between buildings based on HOA health, parking, and proximity to the river trail. Infosparks doesn’t break sold data out by individual building or address, so that neighborhood median is a starting point: your building’s HOA health, parking situation, and floor or view mix will move you above or below it, exactly the kind of nuance a hands-on comp pull catches that an algorithm doesn’t.
Longfellow sellers are receiving a median of 108.7% of original list price (up 5.5% YoY) over the trailing 90 days, a strong sign of multiple offers and bidding above ask. The broader Nokomis community (which spans Wenonah, Minnehaha, Keewaydin, and Morris Park) is running closer to full price at 101.3% (down 1.7% YoY). Longfellow is genuinely the hotter of the two right now, driven by move-up buyers priced out of Southwest Minneapolis and strong demand for bungalow and Cape Cod inventory near the lake and river. Worth noting: Nokomis is a larger, blended community rather than a single neighborhood, so a specific pocket like Keewaydin could run hotter or cooler than that 101.3% average suggests. If you’re the buyer side of one of these bidding situations, our multiple-offer playbook covers the strategies that actually win.
The broader Mpls-Northeast rollup is running at roughly 89% absorption (149 new listings against 132 closed sales, trailing 3 months), but that blended number hides real variation. Audubon Park is running hot at about 91% absorption, Waite Park sits around 85%, and Columbia Park around 80%. St. Anthony Park is essentially fully absorbed at 100% (21 closed against 21 new listings), while St. Anthony East and St. Anthony West are such low-volume markets (5 to 8 listings each) that their ratios can swing sharply on just one or two sales, so treat those two with caution. New construction and teardown-rebuilds are more common here than in the historic Southwest neighborhoods, which widens the price range on any given block and makes accurate initial pricing especially important.
The spread between these three neighboring areas is bigger than you’d expect. Over the trailing six months (single-family):
Neighborhood | Avg. Days on Market | Median Price/Sq Ft |
Powderhorn Park | 21 days (down 43.2% YoY) | $233 (up 13.7% YoY) |
Whittier | 56 days (up 80.6% YoY) | $211 (down 5.0% YoY) |
Central | 70 days (up 125.8% YoY) | $166 (down 23.9% YoY) |
Powderhorn Park is the standout: the only one of the three selling faster than a year ago and the only one appreciating per square foot, helped by proximity to Eat Street, Powderhorn Park itself, and the light rail corridor. Central has swung the other way, with days on market more than doubling, though single-family sales are a small slice of a mostly multifamily neighborhood, so a handful of transactions can move that number more than in a larger market. Whittier sits in the middle: slower than last year, but pricing has only softened modestly. (Cash and investor buyer share isn’t tracked in Infosparks; that would need county deed records or a service like ATTOM or CoreLogic.)
Using rolling 12-month median sold price: Camden is up 4.2% YoY (median $250,000), Near North is up 3.5% YoY (median $250,000), while Willard-Hay is actually down 1.7% YoY (median $255,500). North Minneapolis remains the most affordable entry point into the city and one of the fastest-appreciating areas overall, as buyer demand outpaces the historically lower price point. Camden and Near North exist in Infosparks only as broader community rollups blending several smaller neighborhoods, while Willard-Hay is standalone, so this isn’t perfectly apples-to-apples. The pattern still holds: appreciation across North Minneapolis has been uneven street by street, which is exactly why a single “North Minneapolis is appreciating fast” headline would be misleading for an individual seller here.
Don’t see your neighborhood listed? That’s exactly what an in-person or virtual home evaluation is for. We’ll run comps specific to your address, not a neighborhood average.
Accurate pricing is half the equation. Marketing determines whether your home reaches the buyers who will actually pay top dollar for it. As the #1 REMAX Results Team in Minnesota, we closed 904 homes for $353M+ in 2025, and our listings consistently outperform the market:
That track record is why sellers looking for the best Minneapolis realtor to price and market their home accurately end up working with us. We wrote more about the strategy behind it in Every Home Has a Story: The Best Marketing Makes Buyers Feel It. If you’re circling a fall listing, here’s why now is a better window than you’d think, including one specific fix (getting your exterior photos shot before the leaves turn) that’s easy to miss.
Still deciding whether to list at all? Thinking About Renting Your Home? Why One Conversation Could Change Your Plan and When Offers Arrive, or Don’t are both good next reads. Weighing a move within the metro rather than just within the city? Our Ultimate Guide to Twin Cities Neighborhoods for Homebuyers covers the surrounding suburbs too.
Minneapolis home values in 2026 aren’t one number. They’re dozens, one for nearly every pocket of the city, shifting monthly as new listings and closings come in. The citywide median of $408,475 is useful context, but it won’t tell you what your specific home, on your specific block, is worth to today’s buyers.
Get your free, no-obligation Minneapolis home valuation today, and we’ll show you exactly where your home stands in your neighborhood’s current market.
It depends heavily on your neighborhood, but citywide, Minneapolis homes sold at a median of $408,475 as of July 2026, up 3.4% from a year earlier. Homes near the Chain of Lakes in Southwest Minneapolis typically sell above that median, while more affordable segments like North Minneapolis sell below it. A comparative market analysis using recent, hyperlocal comps is the only accurate way to know your number.
Metro-wide, homes went from listing to pending in an average of 41 days in July 2026, up slightly (2.5%) from a year earlier. Well-priced homes in high-demand neighborhoods often move faster, while overpriced listings or slower-absorbing segments can take longer.
Prices are still rising: the median sales price is up 3.4% year-over-year as of July 2026. Inventory has grown for ten straight months (up 10.1% in the week ending September 5) but still sits at only 3.1 months of supply, below the 5 to 6 months typically considered balanced, which continues to support prices even as the Housing Affordability Index has slipped to 115 from 120 two years ago.
Appreciation varies block by block, but North Minneapolis and Longfellow have shown some of the strongest year-over-year gains as buyers priced out of Southwest Minneapolis and Uptown look for value. Southwest neighborhoods like Linden Hills and Fulton continue to command the highest per-square-foot prices in the city, though appreciation there tends to be steadier rather than fastest.
Automated estimates are a decent starting point but don’t account for renovations, lot specifics, or which homes are actually competing with yours right now. A local agent using live MLS and Infosparks data can show you actual closed comps on your street, plus what’s currently active and pending, a far more accurate number than an algorithm working off public tax data.
The most accurate approach is a comparative market analysis (CMA) from a local agent who pulls recent sold, pending, and active comps specific to your neighborhood, home size, and condition. Request a free home valuation and we’ll walk you through exactly how your home compares to what’s selling around you right now.
Citywide market data sourced from NorthstarMLS via the Minneapolis Area REALTORS® Weekly Market Activity Report, published September 14, 2026, covering the week ending September 5, 2026, and closed-sales data through July 2026. Kerby & Cristina team performance data reflects 2025 closed transactions. Neighborhood-level figures were pulled live from Infosparks as of July 2026 and should be treated as directional until the next quarterly refresh. Some areas (Nokomis, Camden, Near North, Northeast Minneapolis) exist in Infosparks only as blended community rollups; sub-neighborhood figures are provided where available. Cash and investor buyer share is not tracked in Infosparks.