

The agents who win listings and close with confidence are usually the ones who can answer a client’s question before they finish asking it. Two tools make that possible every single day for our team: InfoSparks and ShowingTime. If you’re weighing what kind of support a brokerage actually gives you day to day, this is a good place to start, because these two platforms shape how we price listings, brief clients, and win trust in the room.
Most agents use both tools. Far fewer use them well. Here’s how we run them, including the parts of each platform that most agents never turn on.
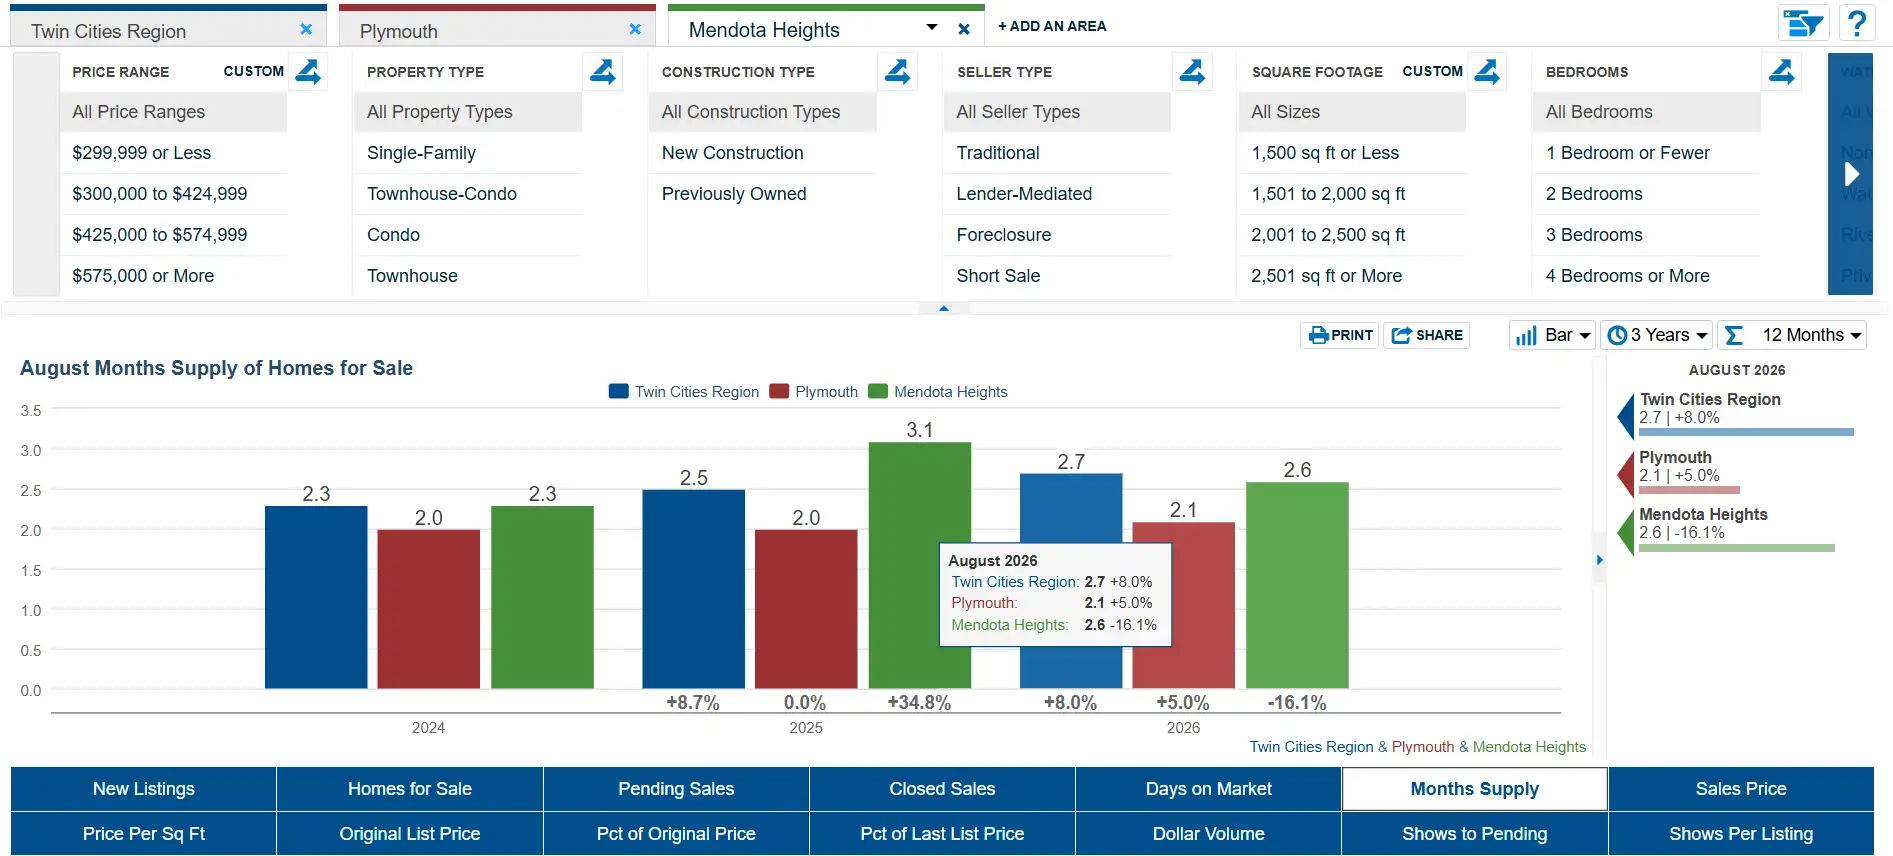
InfoSparks is a market data tool built on live MLS data. Instead of guessing at market conditions or citing a stale Zillow estimate, you can pull real numbers for a specific city, zip code, or neighborhood in seconds. The basics (comparing up to four areas at once, pulling median sale price, days on market, and list-to-sale ratio, tracking months of supply) are table stakes. Here’s what separates a team that has genuinely mastered the tool.
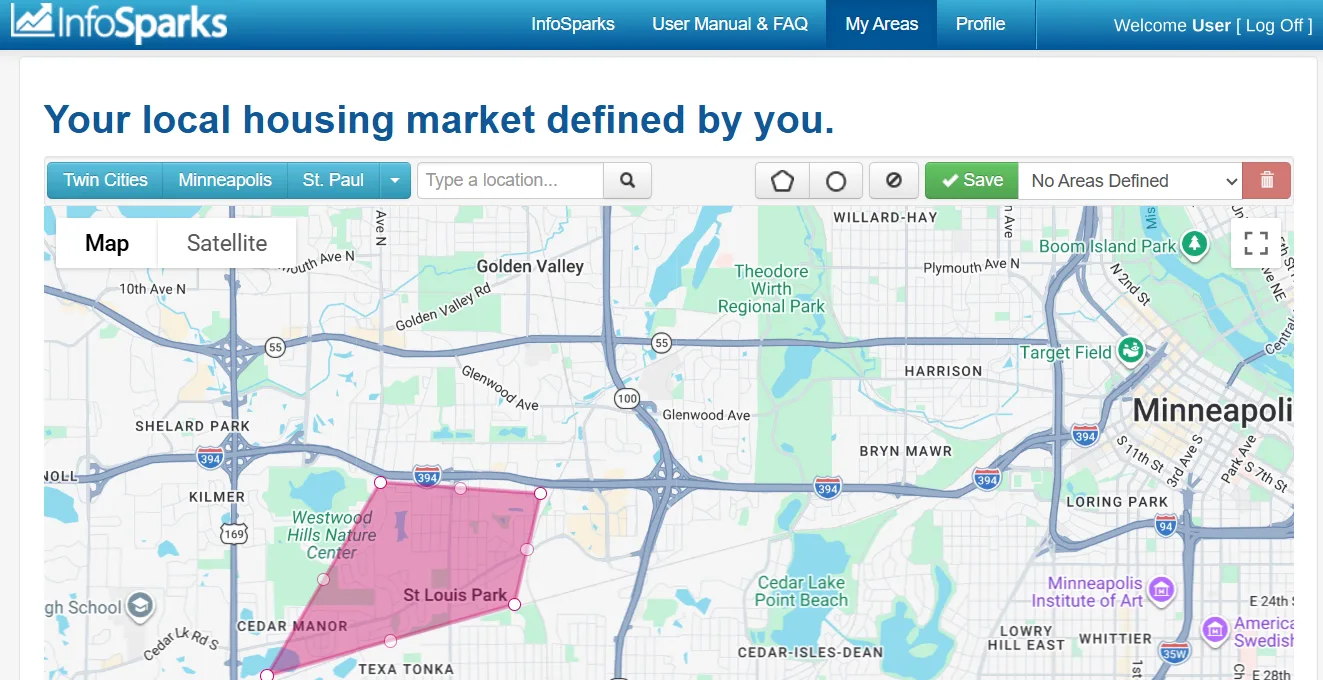
Draw custom market boundaries with My Areas. Zip codes and city lines almost never match how buyers actually think about a neighborhood: a school boundary, a highway, or a lake can split a “market” in half even though it’s one zip code on paper. My Areas lets you draw a custom polygon directly on the map and pull statistics for that exact footprint instead of the nearest official boundary. Build a saved My Area for every micro-neighborhood you farm, so when a seller asks about “the market,” you can show them their actual market, not a zip code that happens to contain their house.
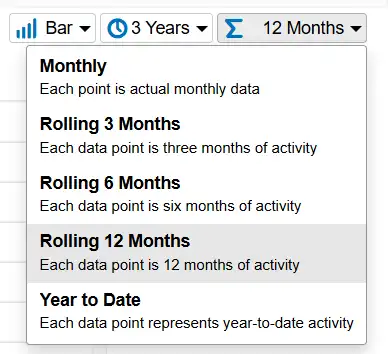
Use Rolling 12 Months to fix the small-sample problem. In a tight micro-neighborhood, a single month might have three sales, which makes month-over-month charts jump around in ways that don’t reflect reality and can spook a client. The Rolling 12 Months time calculation smooths that out by widening the window, which is the difference between “the market crashed last month” and an accurate read on a thin-inventory pocket.
Run MarketView before you walk into a listing appointment, not just InfoSparks. MarketView is the ranking module built into InfoSparks, and most agents never open it. It lets you rank agents, offices, and firms by units, dollar volume, or market share for a specific geography, including a custom My Area, over periods like Rolling 12 Months or Year to Date. Before a listing presentation, pull a MarketView ranking for the seller’s specific neighborhood so you can show, with MLS-sourced numbers, exactly how your production compares to the other agents actively working that market. That’s a very different pitch than simply claiming you sell a lot of homes around here.
Know the shelf life of a shared chart. A chart you share out of InfoSparks stays live for six months and auto-renews as long as you’re an active MLS subscriber and someone is still viewing it, which matters if you’re embedding market charts on a listing page or a drip email that a client might revisit months later. If you need data to persist for analysis rather than a client-facing chart, export the underlying numbers as a CSV instead; that data isn’t tied to the same renewal clock. Knowing which format to use for which purpose keeps you from sending a seller a “market update” link that’s quietly expired.
Insider tip: custom My Areas that sit untouched for 60 days get pushed to an Archived Areas folder. If you farm a neighborhood seasonally, don’t recreate the polygon from scratch; reactivate it from the archive and re-save it so you don’t lose the saved search history attached to it.
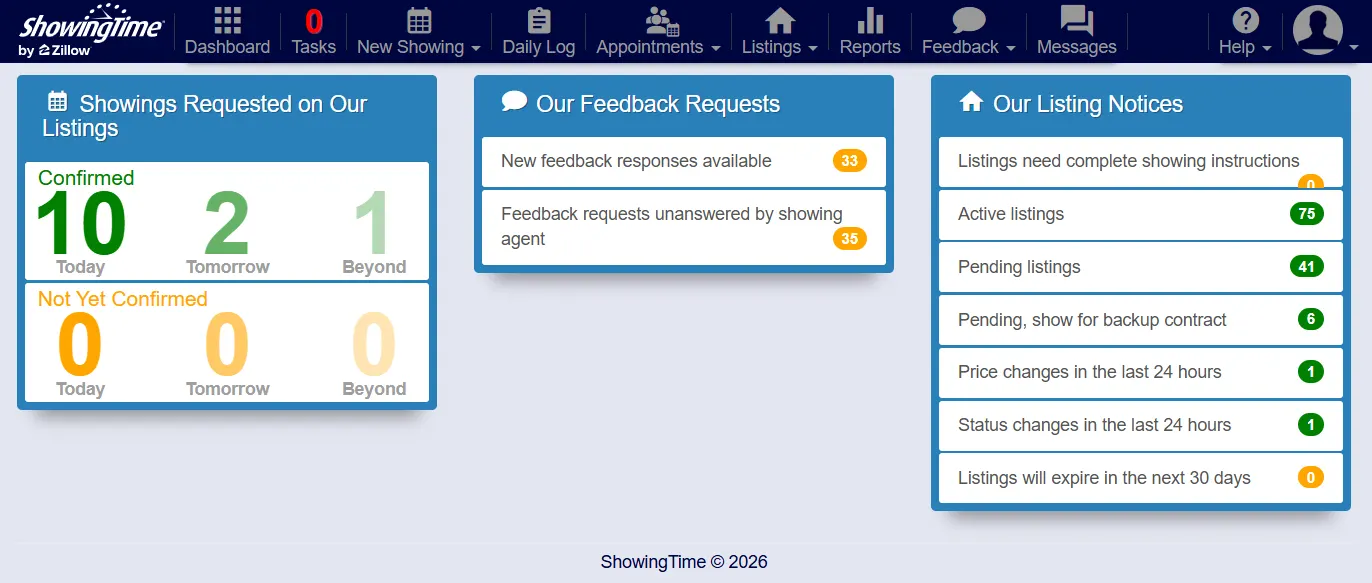
ShowingTime runs the logistics of getting buyers through the door, but treating it as just a scheduling calendar is leaving most of its value on the table.
The Appointment Center is a live team, not just software. Every showing request that comes in, day or night, can be answered by a live Appointment Center specialist, with an average call answer time of around 20 seconds, 24/7/365. For a seller, that means a listing agent’s “office” never closes, even nights and weekends when a buyer’s agent is trying to lock in a Sunday tour.
ShowingCart turns a scattered tour into one booking. For agents touring multiple homes with a buyer, ShowingCart lets you queue an entire day of showings and schedule them together instead of booking each stop one at a time and hoping the timing lines up.
Offer Manager is the most underused feature on a hot listing. When multiple offers come in, Offer Manager builds a professionally formatted, side-by-side comparison of every offer (price, terms, contingencies, and buyer-agent contact details) that a listing agent can generate and send to a seller in about 30 seconds, without rebuilding a spreadsheet by hand every time a new offer lands. In a multiple-offer situation, that speed and clarity is often what keeps a seller calm enough to make a good decision instead of a rushed one.
Target Market Analysis tells you where the showings actually are. This is the report most agents skip, and it’s the one that separates a comp-based price from a demand-based price. It uses live, MLS-wide showing activity to show which price bands are generating the most traffic in a given market: for example, homes priced $150,000–$199,000 might be averaging five showings a week, while $200,000–$250,000 is averaging eight. If your listing is close enough to the band pulling the most traffic, it can make sense to price toward that band rather than strictly toward the nearest comps. This is real-time buyer behavior, not backward-looking sales data, a meaningfully different signal than a CMA alone.
Pricing Benchmark Report handles the price-reduction conversation. When it’s time to talk with a seller about adjusting price, this report pulls comparative market data and pricing benchmarks from directly inside the ShowingTime interface, so you’re not toggling between three tools to build that conversation from scratch.
Sellers get their own window into all of it. Sellers can log into a seller-facing view of showing activity and feedback directly, so they’re never waiting on you to relay an update. That gap between listing day and offer day is where sellers get anxious. ShowingTime keeps it transparent without you playing messenger for every showing.
Any agent can open InfoSparks to pull a chart or open ShowingTime to check a showing confirmation. The habit that actually moves outcomes is layering the two data sources against each other, at each stage of a listing.
Before you take the listing: Pull an InfoSparks snapshot for the seller’s custom My Area (not just their zip code): comparable sales, current months of supply, expected days on market, and run a MarketView ranking for that same footprint so you can speak to the competitive landscape with numbers, not opinions.
The day the listing goes live: ShowingTime starts generating real showing data, and Target Market Analysis starts telling you which price band is pulling the most traffic in that market right now. Compare that against the InfoSparks months-of-supply read for the same area before you finalize the list price. If the two disagree, that’s worth a direct conversation with the seller before the sign goes in the yard, not after.
A week or two in: If InfoSparks shows a tight, fast-moving market but ShowingTime shows low showing volume or lukewarm feedback, that gap is an early warning worth raising immediately, whether the fix is pricing, condition, or presentation. Waiting for the seller to ask why nothing’s happening is a worse conversation than starting it yourself.
At every seller update: Pair a ShowingTime activity report (or, in a multiple-offer scenario, an Offer Manager summary) with an InfoSparks market snapshot in the same update. One shows what buyers are actually doing at the property; the other shows where the broader market stands. Together, they’re a far stronger update than either alone, and if a price change becomes necessary, the Pricing Benchmark Report gives you the data to make that case without it feeling like a guess.
Agents who build this habit into every listing, checking demand data against supply data at each stage and not just at listing intake, tend to have fewer surprised sellers and fewer price reductions that land as a shock, because the data was part of the conversation from day one.
Nearly every agent has access to some version of a market data tool and a showing tool. What separates a strong team isn’t access. It’s whether agents are actually trained to use the underused parts: custom market boundaries, production rankings, demand-based pricing reports, and offer tools that keep a seller calm during the highest-stakes moment of the transaction.
If the way a team supports its agents with tools like these is something you’re weighing right now, we’d be glad to walk you through what a normal week looks like on our team, tools included.
No. InfoSparks is a market data and statistics tool, while ShowingTime manages showing scheduling, feedback, offers, and listing activity. Both are commonly offered through an MLS or association, and many teams use them together.
Both are designed to be usable without a steep learning curve, and most MLS and association providers offer support and tutorials. On our team, agents are walked through both, including the features most agents never open, like My Areas, MarketView, and Target Market Analysis, as part of onboarding.
Yes. ShowingTime offers a seller-facing view so homeowners can see showing confirmations and feedback directly, without waiting on their agent to relay every update.
Pricing Benchmark pulls comparative listing and pricing data to support a pricing or price-reduction conversation. Target Market Analysis is different: it shows live showing-activity volume by price band across the market, so you can see where buyer demand is actually concentrated right now, not just where comparable homes have sold.
It depends on how quickly the market is moving, but pairing an InfoSparks snapshot with a ShowingTime activity report at each seller update is a reliable rhythm for most listings. In a fast-moving or thin-inventory market, lean on the Rolling 12 Months calculation so a slow week doesn’t get misread as a market shift.